luguokong opened a new issue #8292: geo.regions[i].itemStyle.areaColor的文档描述错误
URL: https://github.com/apache/incubator-echarts/issues/8292
### One-line summary [问题简述]
配置手册中geo.regions[i].itemStyle.areaColor的文档有问题
geo.regions[i].itemStyle.areaColor.color设置颜色值不会生效
(1)
> About the complexity, we've tried it in ECharts 2. I think it's not that
> complex and it works fine to me.
The SVG parser in ECharts2 only supports "convert certain SVG to zrender
shape".
I've tested some of the SVG files downloaded from the web on ECharts2 SVG
parser.
Some of them cannot
LJJCherry opened a new issue #8291: 如何实现实现地图作为背景,高亮中国地图
URL: https://github.com/apache/incubator-echarts/issues/8291
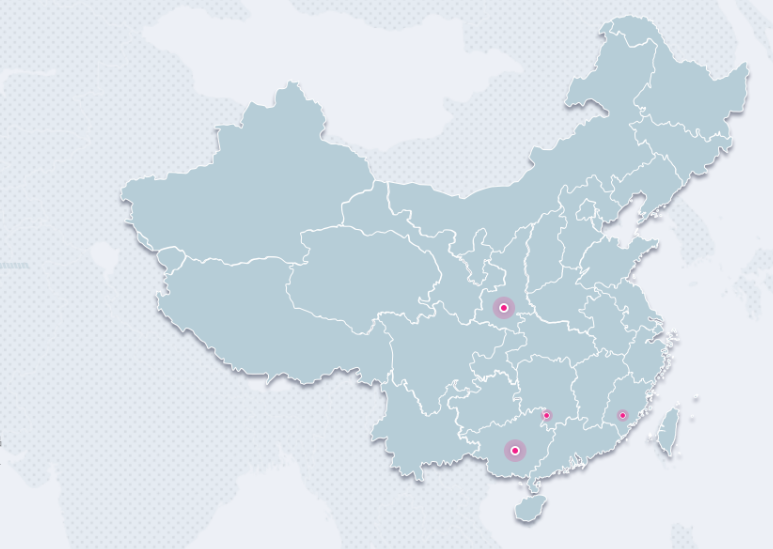
实现效果如图,世界地图作为背景,高亮中国地图
LJJCherry commented on issue #7080: formatter如何嵌入react组件
URL:
https://github.com/apache/incubator-echarts/issues/7080#issuecomment-386775594
formatter 应该是无法解析react组件的,我选择了使用纯html字符串拼接
This is an automated message from the
peach5460 opened a new issue #8290: 如何绘制自定义对象
URL: https://github.com/apache/incubator-echarts/issues/8290
目前我使用Echart主要是散点图和折线图
在散点图里面,我希望能添加自定义的基本对象:
比如说我希望能绘制矩形或者手绘多边形用于框出某些点集做示例;
或者我希望在图中增加一些自定义的文字及箭头做简单的展示说明。
在折线图里我希望添加一些箭头做展示。
但是,目前我在API文档中没有找到相关的接口。
antstudio-git commented on issue #8106: legend的name数组,无法在图表上方显示
URL:
https://github.com/apache/incubator-echarts/issues/8106#issuecomment-386782599
https://user-images.githubusercontent.com/13619768/39660275-baff505c-506d-11e8-9ef1-f1544561cca0.png;>
antstudio-git commented on issue #8106: legend的name数组,无法在图表上方显示
URL:
https://github.com/apache/incubator-echarts/issues/8106#issuecomment-386782599
![Uploading 1-1.png…]()
![Uploading 1-2.png…]()
![Uploading 1-3.png…]()
截图中配置的legend无法显示出来