[GitHub] chfw commented on issue #8289: 如何绑定ecxel中的数据
chfw commented on issue #8289: 如何绑定ecxel中的数据
URL:
https://github.com/apache/incubator-echarts/issues/8289#issuecomment-386653596


   你可以参照这个 https://github.com/pyecharts/pyecharts/issues/524

   现在还是在起步阶段


This is an automated message from the Apache Git Service.
To respond to the message, please log on GitHub and use the
URL above to go to the specific comment.

For queries about this service, please contact Infrastructure at:
us...@infra.apache.org


With regards,
Apache Git Services

-
To unsubscribe, e-mail: dev-unsubscr...@echarts.apache.org
For additional commands, e-mail: dev-h...@echarts.apache.org
[GitHub] shenqi139 opened a new issue #8289: 如何绑定ecxel中的数据
shenqi139 opened a new issue #8289: 如何绑定ecxel中的数据
URL: https://github.com/apache/incubator-echarts/issues/8289


   实际现在很多的数据都是放在excel中  或者csv格式的,但是现在官方貌似没有这方面的教程,并且百度也很多人问的,
我觉得一定可以实现,只是我不知道,所以希望有人看到能教一下子,我也觉得有更多的人都有这方面的疑问,谢谢


This is an automated message from the Apache Git Service.
To respond to the message, please log on GitHub and use the
URL above to go to the specific comment.

For queries about this service, please contact Infrastructure at:
us...@infra.apache.org


With regards,
Apache Git Services

-
To unsubscribe, e-mail: dev-unsubscr...@echarts.apache.org
For additional commands, e-mail: dev-h...@echarts.apache.org
[GitHub] kurryluo commented on issue #7331: geo3d坐标下,lines3D和bar3D 可以共存吗?
kurryluo commented on issue #7331: geo3d坐标下,lines3D和bar3D 可以共存吗?
URL:
https://github.com/apache/incubator-echarts/issues/7331#issuecomment-386887649


   请问最后是怎么解决的?


This is an automated message from the Apache Git Service.
To respond to the message, please log on GitHub and use the
URL above to go to the specific comment.

For queries about this service, please contact Infrastructure at:
us...@infra.apache.org


With regards,
Apache Git Services

-
To unsubscribe, e-mail: dev-unsubscr...@echarts.apache.org
For additional commands, e-mail: dev-h...@echarts.apache.org
[GitHub] LJJCherry commented on issue #7080: formatter如何嵌入react组件
LJJCherry commented on issue #7080: formatter如何嵌入react组件
URL:
https://github.com/apache/incubator-echarts/issues/7080#issuecomment-386775594


   formatter 应该是无法解析react组件的


This is an automated message from the Apache Git Service.
To respond to the message, please log on GitHub and use the
URL above to go to the specific comment.

For queries about this service, please contact Infrastructure at:
us...@infra.apache.org


With regards,
Apache Git Services

-
To unsubscribe, e-mail: dev-unsubscr...@echarts.apache.org
For additional commands, e-mail: dev-h...@echarts.apache.org
[GitHub] antstudio-git commented on issue #8106: legend的name数组,无法在图表上方显示
antstudio-git commented on issue #8106: legend的name数组,无法在图表上方显示
URL:
https://github.com/apache/incubator-echarts/issues/8106#issuecomment-386782599


   https://user-images.githubusercontent.com/13619768/39660275-baff505c-506d-11e8-9ef1-f1544561cca0.png;>
   https://user-images.githubusercontent.com/13619768/39660276-c7081730-506d-11e8-8c34-0a60063162c6.png;>
   https://user-images.githubusercontent.com/13619768/39660279-ceeeb788-506d-11e8-9570-7ae3edf03ad3.png;>

   @pissang

   截图中配置的legend无法显示出来


This is an automated message from the Apache Git Service.
To respond to the message, please log on GitHub and use the
URL above to go to the specific comment.

For queries about this service, please contact Infrastructure at:
us...@infra.apache.org


With regards,
Apache Git Services

-
To unsubscribe, e-mail: dev-unsubscr...@echarts.apache.org
For additional commands, e-mail: dev-h...@echarts.apache.org
[GitHub] antstudio-git commented on issue #8106: legend的name数组,无法在图表上方显示
antstudio-git commented on issue #8106: legend的name数组,无法在图表上方显示
URL:
https://github.com/apache/incubator-echarts/issues/8106#issuecomment-386782599


   ![Uploading 1-1.png…]()
   ![Uploading 1-2.png…]()
   ![Uploading 1-3.png…]()

   截图中配置的legend无法显示出来


This is an automated message from the Apache Git Service.
To respond to the message, please log on GitHub and use the
URL above to go to the specific comment.

For queries about this service, please contact Infrastructure at:
us...@infra.apache.org


With regards,
Apache Git Services

-
To unsubscribe, e-mail: dev-unsubscr...@echarts.apache.org
For additional commands, e-mail: dev-h...@echarts.apache.org
[GitHub] peach5460 opened a new issue #8290: 如何绘制自定义对象
peach5460 opened a new issue #8290: 如何绘制自定义对象
URL: https://github.com/apache/incubator-echarts/issues/8290


   目前我使用Echart主要是散点图和折线图
   在散点图里面,我希望能添加自定义的基本对象:
   比如说我希望能绘制矩形或者手绘多边形用于框出某些点集做示例;
   或者我希望在图中增加一些自定义的文字及箭头做简单的展示说明。
   在折线图里我希望添加一些箭头做展示。

   但是,目前我在API文档中没有找到相关的接口。
   而且,我希望我添加的基本对象能和坐标绑定。

因为我曾经考虑过自己使用canvas的draw来绘制我自己的特定基本对象。但是因为我的draw是基于像素的,所以在页面进行了缩放,大小改变后,我很不方便进行重算。
   因为我自己不方便算DP到LP的转换,所以我的基本对象位置经常跑偏。

   请问:
   1,是否有原生的接口可以用于自定义基本对象的绘制
   2,有没有方法可以方便我进行一些基本对象的锚定


This is an automated message from the Apache Git Service.
To respond to the message, please log on GitHub and use the
URL above to go to the specific comment.

For queries about this service, please contact Infrastructure at:
us...@infra.apache.org


With regards,
Apache Git Services

-
To unsubscribe, e-mail: dev-unsubscr...@echarts.apache.org
For additional commands, e-mail: dev-h...@echarts.apache.org
[GitHub] LJJCherry commented on issue #7080: formatter如何嵌入react组件
LJJCherry commented on issue #7080: formatter如何嵌入react组件
URL:
https://github.com/apache/incubator-echarts/issues/7080#issuecomment-386775090


   楼主最后解决了吗


This is an automated message from the Apache Git Service.
To respond to the message, please log on GitHub and use the
URL above to go to the specific comment.

For queries about this service, please contact Infrastructure at:
us...@infra.apache.org


With regards,
Apache Git Services

-
To unsubscribe, e-mail: dev-unsubscr...@echarts.apache.org
For additional commands, e-mail: dev-h...@echarts.apache.org
[GitHub] heboliufengjie commented on issue #2729: 关系图中,两点之间不能画不同曲度的划线,都重叠在一起了
heboliufengjie commented on issue #2729: 关系图中,两点之间不能画不同曲度的划线,都重叠在一起了
URL:
https://github.com/apache/incubator-echarts/issues/2729#issuecomment-386978064


   https://github.com/apache/incubator-echarts/issues/5688


This is an automated message from the Apache Git Service.
To respond to the message, please log on GitHub and use the
URL above to go to the specific comment.

For queries about this service, please contact Infrastructure at:
us...@infra.apache.org


With regards,
Apache Git Services

-
To unsubscribe, e-mail: dev-unsubscr...@echarts.apache.org
For additional commands, e-mail: dev-h...@echarts.apache.org
[GitHub] Snatch-jie commented on issue #8266: echarts3.8.5 + vue 2.0 实现Map地图下钻,市级click事件偶尔无法获取点击json里面的name属性值
Snatch-jie commented on issue #8266: echarts3.8.5 + vue 2.0
实现Map地图下钻,市级click事件偶尔无法获取点击json里面的name属性值
URL:
https://github.com/apache/incubator-echarts/issues/8266#issuecomment-386976821


   @IdenPin   百度npm 安装echart里面自带的有  这个已经看过了。只有国和省份的。没有市/县的
   您讲的 ‘’高德地图‘’得方法我看看先。
   您发的高德地图得链接---下面的案例 有个山东省的  貌似可以
   万分感谢  提供方法。 谢谢


This is an automated message from the Apache Git Service.
To respond to the message, please log on GitHub and use the
URL above to go to the specific comment.

For queries about this service, please contact Infrastructure at:
us...@infra.apache.org


With regards,
Apache Git Services

-
To unsubscribe, e-mail: dev-unsubscr...@echarts.apache.org
For additional commands, e-mail: dev-h...@echarts.apache.org
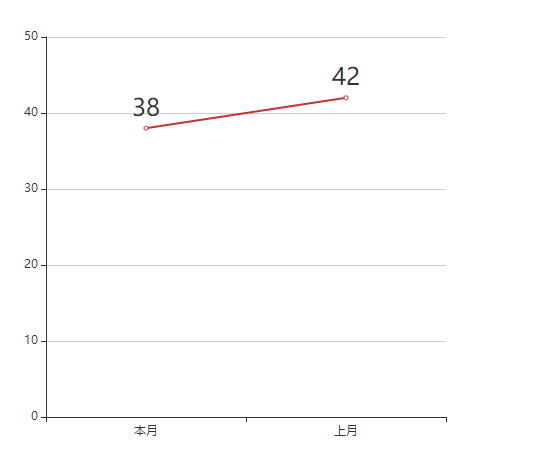
[GitHub] Lestry opened a new issue #8295: 4.1.0版本中使用SVG渲染bar、line的series label存在异常(报错、字体大小异常)
Lestry opened a new issue #8295: 4.1.0版本中使用SVG渲染bar、line的series
label存在异常(报错、字体大小异常)
URL: https://github.com/apache/incubator-echarts/issues/8295
### One-line summary [问题简述]
在使用SVG渲染时:
1、series(type:'bar')中配置了显示label(show:true)的情况报错
2、series(type:'line')中配置的label字体大小异常(截图中为fontSize:12的情况)
### Version & Environment [版本及环境]
+ ECharts version [ECharts 版本]:4.1.0
+ Browser version [浏览器类型和版本]:Chrome 66.0.3359.139 x64
+ OS Version [操作系统类型和版本]:Window 10 x64
### Expected behaviour [期望结果]
1、正常渲染图表
2、字体大小符合配置
### ECharts option [ECharts配置项]
```javascript
option = {
xAxis: [
{
type: 'category',
data: ['本月', '上月'],
}
],
yAxis: [
{
type: 'value'
}
],
series: [
{
name: '数量',
type: 'bar',
silent: true,
label: {
show: true,
position: 'top',
rotate: 0
},
data: [38, 42],
}
]
}
```
### Other comments [其他信息]
This is an automated message from the Apache Git Service.
To respond to the message, please log on GitHub and use the
URL above to go to the specific comment.
For queries about this service, please contact Infrastructure at:
us...@infra.apache.org
With regards,
Apache Git Services
-
To unsubscribe, e-mail: dev-unsubscr...@echarts.apache.org
For additional commands, e-mail: dev-h...@echarts.apache.org
[GitHub] heboliufengjie commented on issue #2729: 关系图中,两点之间不能画不同曲度的划线,都重叠在一起了
heboliufengjie commented on issue #2729: 关系图中,两点之间不能画不同曲度的划线,都重叠在一起了
URL:
https://github.com/apache/incubator-echarts/issues/2729#issuecomment-386978064


   https://github.com/apache/incubator-echarts/issues/5688


This is an automated message from the Apache Git Service.
To respond to the message, please log on GitHub and use the
URL above to go to the specific comment.

For queries about this service, please contact Infrastructure at:
us...@infra.apache.org


With regards,
Apache Git Services

-
To unsubscribe, e-mail: dev-unsubscr...@echarts.apache.org
For additional commands, e-mail: dev-h...@echarts.apache.org
[GitHub] Lestry commented on issue #8295: 4.1.0版本中使用SVG渲染bar、line的series label存在异常(报错、字体大小异常)
Lestry commented on issue #8295: 4.1.0版本中使用SVG渲染bar、line的series
label存在异常(报错、字体大小异常)
URL:
https://github.com/apache/incubator-echarts/issues/8295#issuecomment-386984433


   @pissang


This is an automated message from the Apache Git Service.
To respond to the message, please log on GitHub and use the
URL above to go to the specific comment.

For queries about this service, please contact Infrastructure at:
us...@infra.apache.org


With regards,
Apache Git Services

-
To unsubscribe, e-mail: dev-unsubscr...@echarts.apache.org
For additional commands, e-mail: dev-h...@echarts.apache.org
[GitHub] LonHon closed issue #8277: xAxis.type='time' + zoomData时卡顿问题
LonHon closed issue #8277: xAxis.type='time' + zoomData时卡顿问题
URL: https://github.com/apache/incubator-echarts/issues/8277


This is an automated message from the Apache Git Service.
To respond to the message, please log on GitHub and use the
URL above to go to the specific comment.

For queries about this service, please contact Infrastructure at:
us...@infra.apache.org


With regards,
Apache Git Services

-
To unsubscribe, e-mail: dev-unsubscr...@echarts.apache.org
For additional commands, e-mail: dev-h...@echarts.apache.org
[GitHub] LonHon commented on issue #8277: xAxis.type='time' + zoomData时卡顿问题
LonHon commented on issue #8277: xAxis.type='time' + zoomData时卡顿问题
URL:
https://github.com/apache/incubator-echarts/issues/8277#issuecomment-386968481


   xAxis.type='time' 时通过以下方法解决:
   1. series中设置 showSymbol: false, hoverAnimation: false
   2. option中设置 animation: false, animationDurationUpdate: 0


This is an automated message from the Apache Git Service.
To respond to the message, please log on GitHub and use the
URL above to go to the specific comment.

For queries about this service, please contact Infrastructure at:
us...@infra.apache.org


With regards,
Apache Git Services

-
To unsubscribe, e-mail: dev-unsubscr...@echarts.apache.org
For additional commands, e-mail: dev-h...@echarts.apache.org
[GitHub] onlybabyou opened a new issue #8297: 在地图上添加了点击事件,跳转到省份后加载省级地图 visualMap中的pieces由3级减少到2级,但是我希望它不要减少
onlybabyou opened a new issue #8297: 在地图上添加了点击事件,跳转到省份后加载省级地图
visualMap中的pieces由3级减少到2级,但是我希望它不要减少
URL: https://github.com/apache/incubator-echarts/issues/8297


   var mapStack = [];
   var curMap = {};
   $(function () {

   var provinces = {
   //23个省
   "台湾": "taiwan",
   "河北": "hebei",
   "山西": "shanxi",
   "辽宁": "liaoning",
   "吉林": "jilin",
   "黑龙江": "heilongjiang",
   "江苏": "jiangsu",
   "浙江": "zhejiang",
   "安徽": "anhui",
   "福建": "fujian",
   "江西": "jiangxi",
   "山东": "shandong",
   "河南": "henan",
   "湖北": "hubei",
   "湖南": "hunan",
   "广东": "guangdong",
   "海南": "hainan",
   "四川": "sichuan",
   "贵州": "guizhou",
   "云南": "yunnan",
   "陕西": "shanxi1",
   "甘肃": "gansu",
   "青海": "qinghai",
   //5个自治区
   "新疆": "xinjiang",
   "广西": "guangxi",
   "内蒙古": "neimenggu",
   "宁夏": "ningxia",
   "西藏": "xizang",
   //4个直辖市
   "北京": "beijing",
   "天津": "tianjin",
   "上海": "shanghai",
   "重庆": "chongqing",
   //2个特别行政区
   "香港": "xianggang",
   "澳门": "aomen",
   "china": "china"
   };
   var geoCoordMap = {
   "海南": [110.17, 19.92],
   "河南": [113.700339, 34.751827],
   "河北": [114.54095, 38.058913],
   "湖北": [114.289984, 30.5942],
   "广东": [113.293215, 23.102603],
   "湖南": [113.03042, 28.188898],
   "江西": [115.911671, 28.658012],
   "黑龙江": [126.629804, 45.774197],
   "四川": [104.112035, 30.630737],
   "安徽": [117.321109, 31.850184],
   }
   var data = [{
   name: '海南',
   value: 925.73,
   tooltip: { //单独为海南提示框设置内容
   //   formatter:'pp'
   },
   alarm_num: 54
   }, {
   name: '河南',
   value: 737.01,
   alarm_num: 51
   }, {
   name: '河北',
   value: 177.64
   }, {
   name: '湖北',
   value: 174.96,
   alarm_num: 4
   }, {
   name: '广东',
   value: 230.15
   }, {
   name: '湖南',
   value: 173.05
   }, {
   name: '江西',
   value: 723.08,
   alarm_num: 22
   }, {
   name: '黑龙江',
   value: 629.69
   }, {
   name: '四川',
   value: 158.43,
   alarm_num: 1
   }, {
   name: '安徽',
   value: 930.80
   },];

   var oils = [{
   name: '四川',
   oil95: '75L',
   oil93: '300L',
   value: 930.80
   }, {
   name: '新疆',
   oil95: '165L',
   oil93: '200L',
   value: 900.80
   }, {
   name: '黑龙江',
   oil95: '3575L',
   oil93: '800L',
   value: 130.80
   }, {
   name: '北京',
   oil95: '255L',
   oil93: '1300L',
   value: 230.80
   }, {
   name: '天津',
   oil95: '895L',
   oil93: '4300L',
   value: 330.80
   }, {
   name: '河北',
   oil95: '85L',
   oil93: 400,
   value: 90.80
   }, {
   name: '辽宁',
   oil95: '385L',
   oil93: 800,
   value: 69.80
   }]
   var exclude = ['山东', '浙江', '福建', '广东'];

   function convertData(data) {
   var res = [];
   for (var i = 0; i < data.features.length; i++) {
   var geoCoord = cityMap[data.features[i].properties.name];
   if (geoCoord) {
if(data.features.length - i >
0){
res.push({
name:
[GitHub] Lestry commented on issue #6083: 在手机浏览器(安卓、IOS)中,当echarts图表父级dom的transform进行scale缩放时,出现鼠标焦点偏移的问题。
Lestry commented on issue #6083:
在手机浏览器(安卓、IOS)中,当echarts图表父级dom的transform进行scale缩放时,出现鼠标焦点偏移的问题。
URL:
https://github.com/apache/incubator-echarts/issues/6083#issuecomment-386986315


   最新版本仍然存在这个问题,PC浏览器正常,在移动设备上都不行。


This is an automated message from the Apache Git Service.
To respond to the message, please log on GitHub and use the
URL above to go to the specific comment.

For queries about this service, please contact Infrastructure at:
us...@infra.apache.org


With regards,
Apache Git Services

-
To unsubscribe, e-mail: dev-unsubscr...@echarts.apache.org
For additional commands, e-mail: dev-h...@echarts.apache.org
[GitHub] astik commented on issue #4180: Is possible to define separator, in French thousand separator as made by space and not comma ?
astik commented on issue #4180: Is possible to define separator, in French
thousand separator as made by space and not comma ?
URL:
https://github.com/apache/incubator-echarts/issues/4180#issuecomment-387011074


   One thing to consider as an easy fix : toLocaleString
   * cn :
https://developer.mozilla.org/zh-CN/docs/Web/JavaScript/Reference/Global_Objects/Number/toLocaleString
   * en :
https://developer.mozilla.org/en-US/docs/Web/JavaScript/Reference/Global_Objects/Number/toLocaleString

   It would display number the right way by default depending on environment
locale.


This is an automated message from the Apache Git Service.
To respond to the message, please log on GitHub and use the
URL above to go to the specific comment.

For queries about this service, please contact Infrastructure at:
us...@infra.apache.org


With regards,
Apache Git Services

-
To unsubscribe, e-mail: dev-unsubscr...@echarts.apache.org
For additional commands, e-mail: dev-h...@echarts.apache.org
[GitHub] shentao1 opened a new issue #8296: 折线图渲染出错(在2个点,使用dataset的情况下)
shentao1 opened a new issue #8296: 折线图渲染出错(在2个点,使用dataset的情况下)
URL: https://github.com/apache/incubator-echarts/issues/8296


   ### One-line summary [问题简述]
   折现图dataset有2个点的数据,实际只渲染出了一个点


   ### Version & Environment [版本及环境]
   + ECharts version [ECharts 版本]:4.2.21
   + Browser version [浏览器类型和版本]: chrome 66.0.3359.139
   + OS Version [操作系统类型和版本]:w7


   ### Expected behaviour [期望结果]

   渲染出2个点,能正常渲染数据


   ### ECharts option [ECharts配置项]


   ```javascript
   option = {
   dataset:{"source":[["2018-05-02 00:00:00","85.79"],["2018-05-06
00:00:00","85.79"]],"dimensions":["date","precision_rate"]},
   xAxis: {
   type: 'time'
   },
   yAxis: {
   type: 'value'
   },
   series: [

{"itemStyle":{"color":"#4191fa"},"label":{"fontSize":12,"show":true,"color":"#4191fa","offset":[0,0]},"name":"策略准确率","smooth":false,"symbolSize":8,"symbol":"emptyCircle","showSymbol":true,"type":"line","areaStyle":{"show":false,"color":{"linear":0,"color":"#23539b","linearColor":{"start":"rgba(43,128,207,0.2)","end":"rgba(43,128,207,0.8)"}},"opacity":0},"lineStyle":{"color":"#4191fa","type":"solid","width":2},"value":"precision_rate","encode":{"x":"date","y":"precision_rate"}}
   ]
   };


   ```


   ### Other comments [其他信息]


This is an automated message from the Apache Git Service.
To respond to the message, please log on GitHub and use the
URL above to go to the specific comment.

For queries about this service, please contact Infrastructure at:
us...@infra.apache.org


With regards,
Apache Git Services

-
To unsubscribe, e-mail: dev-unsubscr...@echarts.apache.org
For additional commands, e-mail: dev-h...@echarts.apache.org
[GitHub] LJJCherry opened a new issue #8291: 如何实现实现地图作为背景,高亮中国地图
LJJCherry opened a new issue #8291: 如何实现实现地图作为背景,高亮中国地图
URL: https://github.com/apache/incubator-echarts/issues/8291

实现效果如图,世界地图作为背景,高亮中国地图
### Version & Environment [版本及环境]
+ ECharts version [ECharts 版本]:
+ Browser version [浏览器类型和版本]:
+ OS Version [操作系统类型和版本]:
### Expected behaviour [期望结果]
### ECharts option [ECharts配置项]
```javascript
option = {
}
```
### Other comments [其他信息]
This is an automated message from the Apache Git Service.
To respond to the message, please log on GitHub and use the
URL above to go to the specific comment.
For queries about this service, please contact Infrastructure at:
us...@infra.apache.org
With regards,
Apache Git Services
-
To unsubscribe, e-mail: dev-unsubscr...@echarts.apache.org
For additional commands, e-mail: dev-h...@echarts.apache.org
[GitHub] LJJCherry commented on issue #7080: formatter如何嵌入react组件
LJJCherry commented on issue #7080: formatter如何嵌入react组件
URL:
https://github.com/apache/incubator-echarts/issues/7080#issuecomment-386775594


   formatter 应该是无法解析react组件的,我选择了使用纯html字符串拼接


This is an automated message from the Apache Git Service.
To respond to the message, please log on GitHub and use the
URL above to go to the specific comment.

For queries about this service, please contact Infrastructure at:
us...@infra.apache.org


With regards,
Apache Git Services

-
To unsubscribe, e-mail: dev-unsubscr...@echarts.apache.org
For additional commands, e-mail: dev-h...@echarts.apache.org
[GitHub] luguokong opened a new issue #8292: geo.regions[i].itemStyle.areaColor的文档描述错误
luguokong opened a new issue #8292: geo.regions[i].itemStyle.areaColor的文档描述错误
URL: https://github.com/apache/incubator-echarts/issues/8292


   ### One-line summary [问题简述]

   配置手册中geo.regions[i].itemStyle.areaColor的文档有问题
   geo.regions[i].itemStyle.areaColor.color设置颜色值不会生效
   geo.regions[i].itemStyle.areaColor设置颜色值才会生效

   ### Version & Environment [版本及环境]
   + ECharts version [ECharts 版本]:
   + Browser version [浏览器类型和版本]:
   + OS Version [操作系统类型和版本]:


   ### Expected behaviour [期望结果]


   ### ECharts option [ECharts配置项]


   ```javascript
   option = {

   }

   ```


   ### Other comments [其他信息]


   http://gallery.echartsjs.com/editor.html?c=xrkrKqlj6M=3


This is an automated message from the Apache Git Service.
To respond to the message, please log on GitHub and use the
URL above to go to the specific comment.

For queries about this service, please contact Infrastructure at:
us...@infra.apache.org


With regards,
Apache Git Services

-
To unsubscribe, e-mail: dev-unsubscr...@echarts.apache.org
For additional commands, e-mail: dev-h...@echarts.apache.org
[GitHub] deqingli commented on issue #3187: Sankey: emphasis on all links when node is hovered
deqingli commented on issue #3187: Sankey: emphasis on all links when node is
hovered
URL:
https://github.com/apache/incubator-echarts/issues/3187#issuecomment-387048765


   Hi @jarben,  I have added this feature, which will be released after 4.1.0,
sorry for waiting so long.

   best regards,
   Deqing


This is an automated message from the Apache Git Service.
To respond to the message, please log on GitHub and use the
URL above to go to the specific comment.

For queries about this service, please contact Infrastructure at:
us...@infra.apache.org


With regards,
Apache Git Services

-
To unsubscribe, e-mail: dev-unsubscr...@echarts.apache.org
For additional commands, e-mail: dev-h...@echarts.apache.org
[GitHub] callmeYe opened a new issue #8298: 散点图显示数据维度有误
callmeYe opened a new issue #8298: 散点图显示数据维度有误
URL: https://github.com/apache/incubator-echarts/issues/8298


   ### One-line summary [问题简述]

在官方示例http://echarts.baidu.com/examples/editor.html?c=scatter-weibo中,当鼠标放置在数据点上时,为什么显示的是纬度的值而不是1.


   ### Version & Environment [版本及环境]
   + ECharts version [ECharts 版本]:4
   + Browser version [浏览器类型和版本]:chrome 66.0.3359.139
   + OS Version [操作系统类型和版本]:windows7


   ### Expected behaviour [期望结果]

   当鼠标放置在数据点上时,应该显示的是1


   ### ECharts option [ECharts配置项]


   ```javascript
   option = {

   }

   ```


   ### Other comments [其他信息]


This is an automated message from the Apache Git Service.
To respond to the message, please log on GitHub and use the
URL above to go to the specific comment.

For queries about this service, please contact Infrastructure at:
us...@infra.apache.org


With regards,
Apache Git Services

-
To unsubscribe, e-mail: dev-unsubscr...@echarts.apache.org
For additional commands, e-mail: dev-h...@echarts.apache.org
[GitHub] mqliutie commented on issue #5037: echarts 的series的type为'lines'时,怎么让tooltip显示出该图表的数据?
mqliutie commented on issue #5037: echarts
的series的type为'lines'时,怎么让tooltip显示出该图表的数据?
URL:
https://github.com/apache/incubator-echarts/issues/5037#issuecomment-386530714


   http://www.echartsjs.com/gallery/editor.html?c=geo-lines

   这个例子能实现 `tooltip (value)` 嘛

   分割线
   ```
   tooltip: {
   trigger: 'item',
   formatter: (data) => {
   return data.data.value
   },
   textStyle: {
   fontSize: 24,
   color: 'red'
   }
   }
   ```


This is an automated message from the Apache Git Service.
To respond to the message, please log on GitHub and use the
URL above to go to the specific comment.

For queries about this service, please contact Infrastructure at:
us...@infra.apache.org


With regards,
Apache Git Services

-
To unsubscribe, e-mail: dev-unsubscr...@echarts.apache.org
For additional commands, e-mail: dev-h...@echarts.apache.org
[GitHub] Snatch-jie commented on issue #8270: 需要最新地图数据:地图下钻--全国/省/市-地图下钻--市县地图是旧的
Snatch-jie commented on issue #8270: 需要最新地图数据:地图下钻--全国/省/市-地图下钻--市县地图是旧的
URL:
https://github.com/apache/incubator-echarts/issues/8270#issuecomment-386551991


   @hele10086@万分感谢提供方法(虽然还不会用)。感谢


This is an automated message from the Apache Git Service.
To respond to the message, please log on GitHub and use the
URL above to go to the specific comment.

For queries about this service, please contact Infrastructure at:
us...@infra.apache.org


With regards,
Apache Git Services

-
To unsubscribe, e-mail: dev-unsubscr...@echarts.apache.org
For additional commands, e-mail: dev-h...@echarts.apache.org
[GitHub] c0411034 opened a new issue #8286: 使用浏览器Zoom功能ToolTips鼠标移位问题
c0411034 opened a new issue #8286: 使用浏览器Zoom功能ToolTips鼠标移位问题
URL: https://github.com/apache/incubator-echarts/issues/8286
###使用浏览器Zoom功能ToolTips鼠标移位问题 [问题简述]
### Version & Environment [版本及环境]
+ ECharts version [ECharts 版本]:4.x
+ Browser version [浏览器类型和版本]:chrome
+ OS Version [操作系统类型和版本]:win10
### Expected behaviour [期望结果]尽快修复bug
### ECharts option [ECharts配置项]
```javascript
option = {
}
```
### Other comments [其他信息]
当浏览器使用了css的 zoom 功能时,所有echart的tooltips都出现移位的现象,有时间可以修复一下呀
This is an automated message from the Apache Git Service.
To respond to the message, please log on GitHub and use the
URL above to go to the specific comment.
For queries about this service, please contact Infrastructure at:
us...@infra.apache.org
With regards,
Apache Git Services
-
To unsubscribe, e-mail: dev-unsubscr...@echarts.apache.org
For additional commands, e-mail: dev-h...@echarts.apache.org
[GitHub] hele10086 opened a new issue #8287: echarts3 中如何做到 echarts2 中的水波效果?
hele10086 opened a new issue #8287: echarts3 中如何做到 echarts2 中的水波效果?
URL: https://github.com/apache/incubator-echarts/issues/8287


   ### One-line summary [问题简述]
   在echarts2中配置 markPoint 的 effect 的那种水波动态效果是外圈形状的,而 echarts3 的 effectScatter
配置的 rippleEffect -> brushType: fill 是往外逐渐变淡的,请问一下 echart3 如何能做到 echart2 的那种水波效果?


   ### Version & Environment [版本及环境]
   + ECharts version [ECharts 版本]:
   + Browser version [浏览器类型和版本]:
   + OS Version [操作系统类型和版本]:


   ### Expected behaviour [期望结果]


   ### ECharts option [ECharts配置项]


   ```javascript
   option = {

   }

   ```


   ### Other comments [其他信息]


This is an automated message from the Apache Git Service.
To respond to the message, please log on GitHub and use the
URL above to go to the specific comment.

For queries about this service, please contact Infrastructure at:
us...@infra.apache.org


With regards,
Apache Git Services

-
To unsubscribe, e-mail: dev-unsubscr...@echarts.apache.org
For additional commands, e-mail: dev-h...@echarts.apache.org
[GitHub] pissang commented on issue #8281: 4.1.0 渲染方式改成svg,结果绘制的时候还是canvas
pissang commented on issue #8281: 4.1.0 渲染方式改成svg,结果绘制的时候还是canvas
URL:
https://github.com/apache/incubator-echarts/issues/8281#issuecomment-386498072


   引入 svg 模块了么?


This is an automated message from the Apache Git Service.
To respond to the message, please log on GitHub and use the
URL above to go to the specific comment.

For queries about this service, please contact Infrastructure at:
us...@infra.apache.org


With regards,
Apache Git Services

-
To unsubscribe, e-mail: dev-unsubscr...@echarts.apache.org
For additional commands, e-mail: dev-h...@echarts.apache.org
[GitHub] stdrickforce opened a new issue #8284: PieCharts 和 Legend 结合使用时,会产生关键字冲突的问题
stdrickforce opened a new issue #8284: PieCharts 和 Legend 结合使用时,会产生关键字冲突的问题
URL: https://github.com/apache/incubator-echarts/issues/8284


   ### One-line summary [问题简述]

   pieCharts 在使用 legend 的时候,如果数据和图例的名字都为 get 的话,会报错导致图片无法出来。

   稍微看了一下,应该是 createHashmap 占用了 get / set / constructor / each / removeKey
这几个关键字,而 legend 组件用到了 hashmap,从而在业务中包含 get 图例时,get 方法被覆盖,导致错误。


   ### Version & Environment [版本及环境]
   + ECharts version [ECharts 版本]:
   4.1.0
   + Browser version [浏览器类型和版本]:
   Google Chrome Version 65.0.3325.181 (Official Build) (64-bit)
   + OS Version [操作系统类型和版本]:
   macOS High Sierra Version 10.13.3(17D102)


   ### Expected behaviour [期望结果]
   可以正常显示 get 的图例


   ### ECharts option [ECharts配置项]
   ```
   option = {
   title : {
   text: '测试',
   subtext: '纯属虚构',
   x:'center'
   },
   legend: {
   orient: 'vertical',
   left: 'left',
   data: ['get', 'set']
   },
   series : [
   {
   name: '访问来源',
   type: 'pie',
   radius : '55%',
   center: ['50%', '60%'],
   data:[
   {value:335, name:'get'},
   {value:310, name:'set'},
   ],
   }
   ]
   };

   ```

   ### Other comments [其他信息]
   测试代码就在压缩包里

[test.zip](https://github.com/apache/incubator-echarts/files/1973416/test.zip)


This is an automated message from the Apache Git Service.
To respond to the message, please log on GitHub and use the
URL above to go to the specific comment.

For queries about this service, please contact Infrastructure at:
us...@infra.apache.org


With regards,
Apache Git Services

-
To unsubscribe, e-mail: dev-unsubscr...@echarts.apache.org
For additional commands, e-mail: dev-h...@echarts.apache.org
[GitHub] jarben commented on issue #3187: Sankey: emphasis on all links when node is hovered
jarben commented on issue #3187: Sankey: emphasis on all links when node is
hovered
URL:
https://github.com/apache/incubator-echarts/issues/3187#issuecomment-387078647


   That great new @deqingli , thanks for looking at it!


This is an automated message from the Apache Git Service.
To respond to the message, please log on GitHub and use the
URL above to go to the specific comment.

For queries about this service, please contact Infrastructure at:
us...@infra.apache.org


With regards,
Apache Git Services

-
To unsubscribe, e-mail: dev-unsubscr...@echarts.apache.org
For additional commands, e-mail: dev-h...@echarts.apache.org
[GitHub] tantaiMoon commented on issue #4678: 关于折线图y轴刻度自定义的问题
tantaiMoon commented on issue #4678: 关于折线图y轴刻度自定义的问题
URL:
https://github.com/apache/incubator-echarts/issues/4678#issuecomment-388730369


   yAxis: [
   {
   type: 'value',
   name: '在厅人数(人)',
   min: 0,
   max: 100,
   interval:5
   axisLabel: {
   formatter: function (value, index) {
   return value
   }
   }
   }
   ],

   我想显示0,5,10,15,20,25,50,75,100改如何处理?


This is an automated message from the Apache Git Service.
To respond to the message, please log on GitHub and use the
URL above to go to the specific comment.

For queries about this service, please contact Infrastructure at:
us...@infra.apache.org


With regards,
Apache Git Services

-
To unsubscribe, e-mail: dev-unsubscr...@echarts.apache.org
For additional commands, e-mail: dev-h...@echarts.apache.org
[GitHub] giorgiopagnoni commented on issue #8288: Google charts: timelines [question]
giorgiopagnoni commented on issue #8288: Google charts: timelines [question]
URL:
https://github.com/apache/incubator-echarts/issues/8288#issuecomment-388733661


   @100pah thank you; drop me a line when the legend works. What I tried didn't
really work.


This is an automated message from the Apache Git Service.
To respond to the message, please log on GitHub and use the
URL above to go to the specific comment.

For queries about this service, please contact Infrastructure at:
us...@infra.apache.org


With regards,
Apache Git Services

-
To unsubscribe, e-mail: dev-unsubscr...@echarts.apache.org
For additional commands, e-mail: dev-h...@echarts.apache.org
[GitHub] Adelaide1014 commented on issue #8096: 气泡图dataset控制symboSize
Adelaide1014 commented on issue #8096: 气泡图dataset控制symboSize
URL:
https://github.com/apache/incubator-echarts/issues/8096#issuecomment-388737206


   visualMap感觉是用来控制在某个范围内的数据展示样式,与不再数据范围内的数据展示样式的,不是用来设置数据大小的


This is an automated message from the Apache Git Service.
To respond to the message, please log on GitHub and use the
URL above to go to the specific comment.

For queries about this service, please contact Infrastructure at:
us...@infra.apache.org


With regards,
Apache Git Services

-
To unsubscribe, e-mail: dev-unsubscr...@echarts.apache.org
For additional commands, e-mail: dev-h...@echarts.apache.org
[GitHub] elliot-cj commented on issue #8313: Feature: tree 增加直角线条功能
elliot-cj commented on issue #8313: Feature: tree 增加直角线条功能
URL:
https://github.com/apache/incubator-echarts/issues/8313#issuecomment-388735285


   这个问题我也碰到了,有好的替代方案么


This is an automated message from the Apache Git Service.
To respond to the message, please log on GitHub and use the
URL above to go to the specific comment.

For queries about this service, please contact Infrastructure at:
us...@infra.apache.org


With regards,
Apache Git Services

-
To unsubscribe, e-mail: dev-unsubscr...@echarts.apache.org
For additional commands, e-mail: dev-h...@echarts.apache.org
[GitHub] giorgiopagnoni commented on issue #8288: Google charts: timelines [question]
giorgiopagnoni commented on issue #8288: Google charts: timelines [question]
URL:
https://github.com/apache/incubator-echarts/issues/8288#issuecomment-388733661


   @100pah thank you; drop me a line when the legend works


This is an automated message from the Apache Git Service.
To respond to the message, please log on GitHub and use the
URL above to go to the specific comment.

For queries about this service, please contact Infrastructure at:
us...@infra.apache.org


With regards,
Apache Git Services

-
To unsubscribe, e-mail: dev-unsubscr...@echarts.apache.org
For additional commands, e-mail: dev-h...@echarts.apache.org
[GitHub] pissang closed issue #8157: how do I clear a chart? Basically I need to re-initialize it.
pissang closed issue #8157: how do I clear a chart? Basically I need to
re-initialize it.
URL: https://github.com/apache/incubator-echarts/issues/8157


This is an automated message from the Apache Git Service.
To respond to the message, please log on GitHub and use the
URL above to go to the specific comment.

For queries about this service, please contact Infrastructure at:
us...@infra.apache.org


With regards,
Apache Git Services

-
To unsubscribe, e-mail: dev-unsubscr...@echarts.apache.org
For additional commands, e-mail: dev-h...@echarts.apache.org
[GitHub] 80243278 opened a new issue #8334: 请问:树状图里支持异步加载吗。
80243278 opened a new issue #8334: 请问:树状图里支持异步加载吗。
URL: https://github.com/apache/incubator-echarts/issues/8334


   ### One-line summary [问题简述]
   因为咱们现用的版本的echart生成树图是将所有数据全部加载到前台,进行生成树图。能否支持异步加载数据,即点击某一个树形节点时,加载其子节点的数据。


   ### Version & Environment [版本及环境]
   + ECharts version [ECharts 版本]: v4.1.0.rc2
   + Browser version [浏览器类型和版本]:ie11
   + OS Version [操作系统类型和版本]:window7 X64


   ### Expected behaviour [期望结果]
   能实现异步加载子节点数据。

   ### ECharts option [ECharts配置项]


   ```javascript
   option = {

   }

   ```


   ### Other comments [其他信息]


This is an automated message from the Apache Git Service.
To respond to the message, please log on GitHub and use the
URL above to go to the specific comment.

For queries about this service, please contact Infrastructure at:
us...@infra.apache.org


With regards,
Apache Git Services

-
To unsubscribe, e-mail: dev-unsubscr...@echarts.apache.org
For additional commands, e-mail: dev-h...@echarts.apache.org
[GitHub] Xixi20160512 commented on issue #7133: 图例过多高度自适应问题
Xixi20160512 commented on issue #7133: 图例过多高度自适应问题
URL:
https://github.com/apache/incubator-echarts/issues/7133#issuecomment-388778863


   加滚动 测试提bug怎么办 哈哈


This is an automated message from the Apache Git Service.
To respond to the message, please log on GitHub and use the
URL above to go to the specific comment.

For queries about this service, please contact Infrastructure at:
us...@infra.apache.org


With regards,
Apache Git Services

-
To unsubscribe, e-mail: dev-unsubscr...@echarts.apache.org
For additional commands, e-mail: dev-h...@echarts.apache.org
[GitHub] ZSH-HSZ commented on issue #8023: 关于legend自定义显示的问题
ZSH-HSZ commented on issue #8023: 关于legend自定义显示的问题
URL:
https://github.com/apache/incubator-echarts/issues/8023#issuecomment-388851485


   可以设置饼状图的位置


This is an automated message from the Apache Git Service.
To respond to the message, please log on GitHub and use the
URL above to go to the specific comment.

For queries about this service, please contact Infrastructure at:
us...@infra.apache.org


With regards,
Apache Git Services

-
To unsubscribe, e-mail: dev-unsubscr...@echarts.apache.org
For additional commands, e-mail: dev-h...@echarts.apache.org
[GitHub] MahoneHuang commented on issue #4678: 关于折线图y轴刻度自定义的问题
MahoneHuang commented on issue #4678: 关于折线图y轴刻度自定义的问题
URL:
https://github.com/apache/incubator-echarts/issues/4678#issuecomment-389005860


“数据值太大,值小的数据全部堆积在一起,视觉效果很差”,如果echart暂时还不支持自定义轴间距,可以考虑将数据转化一下再画图。比如做一下离散化处理或者同时除以某个数(均值,中位等)。只要不破坏数据之间的关系即可。


This is an automated message from the Apache Git Service.
To respond to the message, please log on GitHub and use the
URL above to go to the specific comment.

For queries about this service, please contact Infrastructure at:
us...@infra.apache.org


With regards,
Apache Git Services

-
To unsubscribe, e-mail: dev-unsubscr...@echarts.apache.org
For additional commands, e-mail: dev-h...@echarts.apache.org
[GitHub] MerlChen commented on issue #8235: 【折线图堆叠BUG】
MerlChen commented on issue #8235: 【折线图堆叠BUG】
URL:
https://github.com/apache/incubator-echarts/issues/8235#issuecomment-389015637


   实现的逻辑是不是有点问题呢?
   如果说一条线的值有若干点为0,结果跑到相邻的线上的点去了,这样觉得还是不好的吧?
   丢失了数据的真实性


This is an automated message from the Apache Git Service.
To respond to the message, please log on GitHub and use the
URL above to go to the specific comment.

For queries about this service, please contact Infrastructure at:
us...@infra.apache.org


With regards,
Apache Git Services

-
To unsubscribe, e-mail: dev-unsubscr...@echarts.apache.org
For additional commands, e-mail: dev-h...@echarts.apache.org
[GitHub] iamziyue opened a new issue #8336: 堆叠柱状图在设置y轴scale属性的情况下超出范围
iamziyue opened a new issue #8336: 堆叠柱状图在设置y轴scale属性的情况下超出范围
URL: https://github.com/apache/incubator-echarts/issues/8336


   ### One-line summary [问题简述]
   当设置value轴的scale: true时,柱状图底部超过水平的x轴。当不设置scale属性时正常。有问题的堆叠图切换为平铺图形后,正常。

   ### Version & Environment [版本及环境]
   + ECharts version [ECharts 版本]: v4.1.0.rc2
   + Browser version [浏览器类型和版本]: QQ浏览器10.0.1,Chrome内核
   + OS Version [操作系统类型和版本]: Win10

   ### ECharts option [ECharts配置项]


   ```javascript
   option = {
 dataset: {
   source: {
 '脱落': ['战胜焦虑', '走出抑郁', '远离失眠', '直面强迫'],
 '第1次': [11, 12, 5, 6],
 '第2次': [6, 2, 0, 0],
 '第3次': [8, 6, 2, 0],
 '第4次': [2, 2, 1, 1],
 '第5次': [1, 0, 0, 0],
 '第6次': [1, 0, 0, 1]
   }
 },
 grid: {
   left: 0,
   right: 10,
   containLabel: true
 },
 tooltip: {
   trigger: 'axis',
   axisPointer: { type: 'shadow' }
 },
 toolbox: {
   feature: {
 magicType: { type: ['tiled'] },
 restore: {}
   }
 },
 legend: {},
 xAxis: {
   type: 'category',
 },
 yAxis: {
   type: 'value',
   scale: true
 },
 series: [{
   type: 'bar',
   stack: '总量'
 }, {
   type: 'bar',
   stack: '总量'
 }, {
   type: 'bar',
   stack: '总量'
 }, {
   type: 'bar',
   stack: '总量'
 }, {
   type: 'bar',
   stack: '总量'
 }, {
   type: 'bar',
   stack: '总量'
 }]
   }

   ```


This is an automated message from the Apache Git Service.
To respond to the message, please log on GitHub and use the
URL above to go to the specific comment.

For queries about this service, please contact Infrastructure at:
us...@infra.apache.org


With regards,
Apache Git Services

-
To unsubscribe, e-mail: dev-unsubscr...@echarts.apache.org
For additional commands, e-mail: dev-h...@echarts.apache.org
[GitHub] flyingfish3 commented on issue #3501: 如何修改坐标轴的样式,以及坐标值的位置
flyingfish3 commented on issue #3501: 如何修改坐标轴的样式,以及坐标值的位置
URL:
https://github.com/apache/incubator-echarts/issues/3501#issuecomment-389021260


   1、x轴:xAxis.axisLine.symbol=['none','arrow'],y轴同


This is an automated message from the Apache Git Service.
To respond to the message, please log on GitHub and use the
URL above to go to the specific comment.

For queries about this service, please contact Infrastructure at:
us...@infra.apache.org


With regards,
Apache Git Services

-
To unsubscribe, e-mail: dev-unsubscr...@echarts.apache.org
For additional commands, e-mail: dev-h...@echarts.apache.org
[GitHub] hanfengcan commented on issue #8023: 关于legend自定义显示的问题
hanfengcan commented on issue #8023: 关于legend自定义显示的问题
URL:
https://github.com/apache/incubator-echarts/issues/8023#issuecomment-389007890


   @ZSH-HSZ 设置位置只能简单的避免,如果有系列名很长的话,也可能会影响到.

   不过可以将数量小的整合成其他


This is an automated message from the Apache Git Service.
To respond to the message, please log on GitHub and use the
URL above to go to the specific comment.

For queries about this service, please contact Infrastructure at:
us...@infra.apache.org


With regards,
Apache Git Services

-
To unsubscribe, e-mail: dev-unsubscr...@echarts.apache.org
For additional commands, e-mail: dev-h...@echarts.apache.org
[GitHub] liwenda122 commented on issue #6902: echarts+bmap怎么去掉百度地图的底图可点功能。echarts怎么引用外部字体?
liwenda122 commented on issue #6902:
echarts+bmap怎么去掉百度地图的底图可点功能。echarts怎么引用外部字体?
URL:
https://github.com/apache/incubator-echarts/issues/6902#issuecomment-389015670


   去掉地图可点 只能自己改源码:
   echarts\extension\bmap\BMapCoordSys.js
   var bmap = bmapModel.__bmap = new BMap.Map(bmapRoot, {
   enableMapClick: false
   });
   然后自己重新打包:
   node build/build.js --release


This is an automated message from the Apache Git Service.
To respond to the message, please log on GitHub and use the
URL above to go to the specific comment.

For queries about this service, please contact Infrastructure at:
us...@infra.apache.org


With regards,
Apache Git Services

-
To unsubscribe, e-mail: dev-unsubscr...@echarts.apache.org
For additional commands, e-mail: dev-h...@echarts.apache.org
[GitHub] MerlChen opened a new issue #8337: 【急急急---Stacked Line Chart -- 数据点不准确标记】
MerlChen opened a new issue #8337: 【急急急---Stacked Line Chart -- 数据点不准确标记】
URL: https://github.com/apache/incubator-echarts/issues/8337
### One-line summary [问题简述]
当某一个点的值为0时,数据点会到其他对应X轴的其他点上去,而不是到Y轴的0点坐标
### Version & Environment [版本及环境]
+ ECharts version [ECharts 版本]: 3.0
+ Browser version [浏览器类型和版本]: GoogleChrome 66.0.3359.170(正式版本) (32 位)
+ OS Version [操作系统类型和版本]: Windows7 旗舰版 64Bit
### Expected behaviour [期望结果]
数据点准确显示
### ECharts option [ECharts配置项]
```javascript
option = {
title: {
text: '折线图堆叠'
},
tooltip: {
trigger: 'axis'
},
legend: {
data:['邮件营销','联盟广告','视频广告','直接访问','搜索引擎']
},
grid: {
left: '3%',
right: '4%',
bottom: '3%',
containLabel: true
},
toolbox: {
feature: {
saveAsImage: {}
}
},
xAxis: {
type: 'category',
boundaryGap: false,
data: ['周一','周二','周三','周四','周五','周六','周日']
},
yAxis: {
type: 'value'
},
series: [
{
name:'邮件营销',
type:'line',
stack: '总量',
data:[120, 0, 101, 134, 90, 230, 210]
},
{
name:'联盟广告',
type:'line',
stack: '总量',
data:[220, 182, 0, 234, 290, 330, 310]
},
{
name:'视频广告',
type:'line',
stack: '总量',
data:[150, 232, 201, 154, 0, 330, 410]
},
{
name:'直接访问',
type:'line',
stack: '总量',
data:[320, 332, 301, 334, 390, 330, 0]
},
{
name:'搜索引擎',
type:'line',
stack: '总量',
data:[820, 932, 901, 934, 0, 1330, 1320]
}
]
};
```
### Other comments [其他信息]
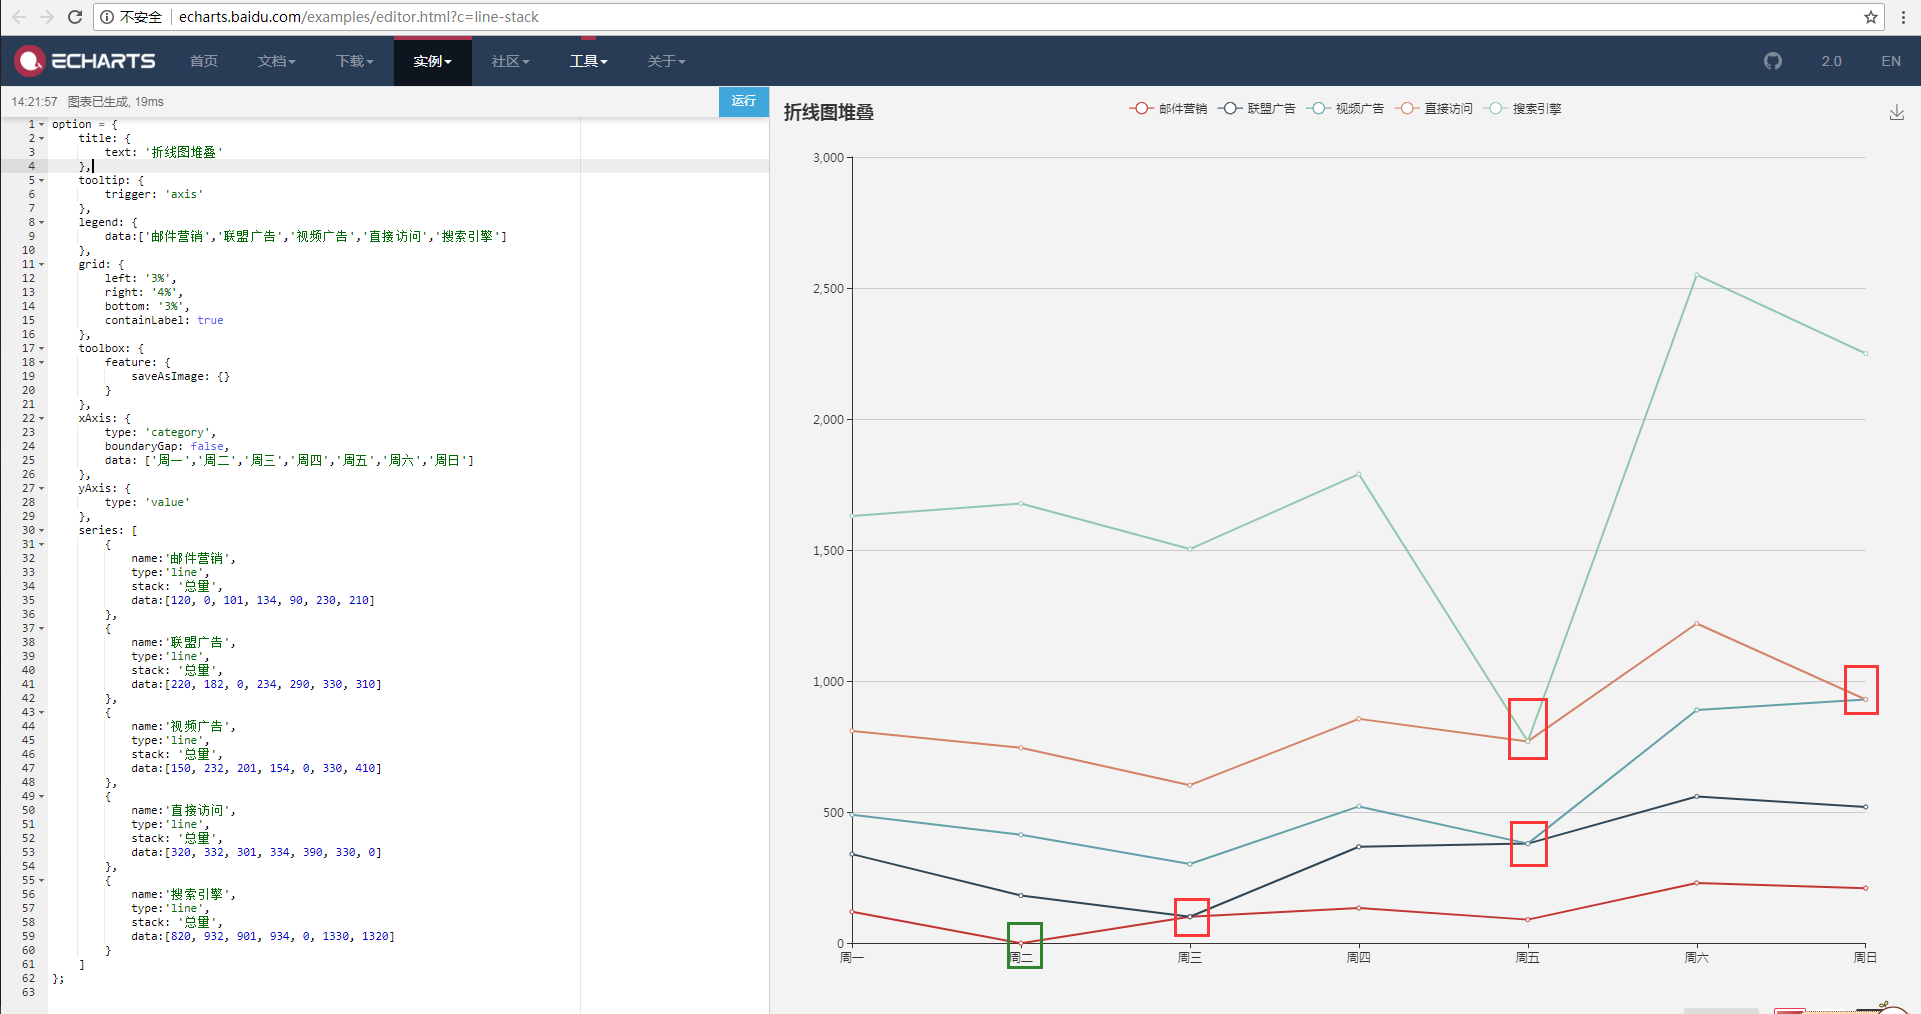
```
求紧急处理一下,或者线上求教:
QQ:379181273
```
This is an automated message from the Apache Git Service.
To respond to the message, please log on GitHub and use the
URL above to go to the specific comment.
For queries about this service, please contact Infrastructure at:
us...@infra.apache.org
With regards,
Apache Git Services
-
To unsubscribe, e-mail: dev-unsubscr...@echarts.apache.org
For additional commands, e-mail: dev-h...@echarts.apache.org
[GitHub] zx69 opened a new issue #8338: 数据堆叠时最大值计算错误
zx69 opened a new issue #8338: 数据堆叠时最大值计算错误
URL: https://github.com/apache/incubator-echarts/issues/8338


   ### One-line summary [问题简述]
   项目中同时采用stack数据堆叠、series.data数据分组,结果柱状图的高度超出yAxis的最大值,突出图表。
   配置项如下:
   ```
   option = {
 "title": {
   "text": "每日各工位分时执行量统计"
 },
 "color": [
   "#91c7ae",
   "#c23531",
   "#6e7074",
   "#749f83",
   "#d48265",
   "#2f4554",
   "#61a0a8",
   "#ca8622",
   "#546570",
   "#bda29a",
   "#c4ccd3"
 ],
 "tooltip": {
   "trigger": "axis",
   "axisPointer": {
 "type": "cross",
 "label": {
   "precision": 0
 },
 "crossStyle": {
   "color": "#999"
 }
   }
 },
 "legend": {
   "right": 0,
   "data": [
 "入库单数",
 "出库单数",
 "盘点单数",
 "入库SKU数",
 "出库SKU数",
 "盘点SKU数"
   ]
 },
 "xAxis": [
   {
 "data": [
   "05-15-00时",
   "05-15-01时",
   "05-15-02时",
   "05-15-03时",
   "05-15-04时",
   "05-15-05时",
   "05-15-06时",
   "05-15-07时",
   "05-15-08时",
   "05-15-09时",
   "05-15-10时",
   "05-15-11时",
   "05-15-12时",
   "05-15-13时",
   "05-15-14时",
   "05-15-15时",
   "05-15-16时",
   "05-15-17时",
   "05-15-18时",
   "05-15-19时",
   "05-15-20时",
   "05-15-21时",
   "05-15-22时",
   "05-15-23时",
   "05-12-00时",
   "05-12-01时",
   "05-12-02时",
   "05-12-03时",
   "05-12-04时",
   "05-12-05时",
   "05-12-06时",
   "05-12-07时",
   "05-12-08时",
   "05-12-09时",
   "05-12-10时",
   "05-12-11时",
   "05-12-12时",
   "05-12-13时",
   "05-12-14时",
   "05-12-15时",
   "05-12-16时",
   "05-12-17时",
   "05-12-18时",
   "05-12-19时",
   "05-12-20时",
   "05-12-21时",
   "05-12-22时",
   "05-12-23时",
   "05-04-00时",
   "05-04-01时",
   "05-04-02时",
   "05-04-03时",
   "05-04-04时",
   "05-04-05时",
   "05-04-06时",
   "05-04-07时",
   "05-04-08时",
   "05-04-09时",
   "05-04-10时",
   "05-04-11时",
   "05-04-12时",
   "05-04-13时",
   "05-04-14时",
   "05-04-15时",
   "05-04-16时",
   "05-04-17时",
   "05-04-18时",
   "05-04-19时",
   "05-04-20时",
   "05-04-21时",
   "05-04-22时",
   "05-04-23时",
   "05-03-00时",
   "05-03-01时",
   "05-03-02时",
   "05-03-03时",
   "05-03-04时",
   "05-03-05时",
   "05-03-06时",
   "05-03-07时",
   "05-03-08时",
   "05-03-09时",
   "05-03-10时",
   "05-03-11时",
   "05-03-12时",
   "05-03-13时",
   "05-03-14时",
   "05-03-15时",
   "05-03-16时",
   "05-03-17时",
   "05-03-18时",
   "05-03-19时",
   "05-03-20时",
   "05-03-21时",
   "05-03-22时",
   "05-03-23时"
 ],
 "axisPointer": {
   "type": "shadow"
 }
   }
 ],
 "yAxis": [
   {
 "type": "value",
 "name": "处理单数",
 "axisLabel": {
   "formatter": "{value}单"
 }
   },
   {
 "type": "value",
 "name": "处理SKU数",
 "axisLabel": {
   "formatter": "{value}件"
 }
   }
 ],
 "series": [
   {
 "name": "出库单数",
 "type": "bar",
 "yAxisIndex": 0,
 "stack": "出库单数",
 "itemStyle": {
   "color": "#c23531"
 },
 "data": [
   [
 "05-15-10时",
 3,
 "STATIONA"
   ],
   [
 "05-15-10时",
 3,
 "STATIONA"
   ]
 ]
   },
   {
 "name": "出库SKU数",
 "type": "bar",
 "yAxisIndex": 1,
 "stack": "出库SKU数",
 "itemStyle": {
   "color": "#d48265"
 },
 "data": [
   [
 "05-15-10时",
 3,
 "STATIONA"
   ],
   [
 "05-15-10时",
 3,
 "STATIONA"
   ]
 ]
   },
   {
 "name": "盘点单数",
 "type": "bar",
 "yAxisIndex": 0,
 "stack": "盘点单数",
 "itemStyle": {
   "color": "#546570"
 },
 "data": [
   [
 "05-12-15时",
 1,
 "STATIONC"
   ]
 ]
   },
   {
 "name": "盘点SKU数",
 "type": "bar",
 "yAxisIndex": 1,
 "stack": "盘点SKU数",
 "itemStyle": {
   "color": "#2f4554"
 },
[GitHub] wunayou opened a new issue #8339: 一个很低级版本的BUG 折线图 单个name 文本的样式设置不了
wunayou opened a new issue #8339: 一个很低级版本的BUG 折线图  单个name 文本的样式设置不了
URL: https://github.com/apache/incubator-echarts/issues/8339


   ### One-line summary [问题简述]
   第一步打开官网的DEMO
   http://echarts.baidu.com/examples/editor.html?c=line-simple

   第二步 改数据
   `option = {
   xAxis: {
   type: 'category',
   data: [{value:'123',textStyle:{color:'red'}}, 'Tue', 'Wed', 'Thu',
'Fri', 'Sat', 'Sun']
   },
   yAxis: {
   type: 'value'
   },
   series: [{
   data: [820, 932, 901, 934, 1290, 1330, 1320],
   type: 'line'
   }]
   };
   `
   把DATA的数据 改成对象 然后运行 ,字体变成红色了

   但是 我如果改成 把red 变成“#212121” 就没有效果了?
   `option = {
   xAxis: {
   type: 'category',
   data: [{value:'123',textStyle:{color:'#212121'}}, 'Tue', 'Wed',
'Thu', 'Fri', 'Sat', 'Sun']
   },
   yAxis: {
   type: 'value'
   },
   series: [{
   data: [820, 932, 901, 934, 1290, 1330, 1320],
   type: 'line'
   }]
   };
   `


   ### Version & Environment [版本及环境]
   + ECharts version [ECharts 版本]:
   + Browser version [浏览器类型和版本]:
   + OS Version [操作系统类型和版本]:

   版本用的 4.0
   浏览器chrome


   ### Expected behaviour [期望结果]

   期望可以改成 非英文的 颜色


   ### ECharts option [ECharts配置项]


   ```javascript
   option = {
   xAxis: {
   type: 'category',
   data: [{value:'123',textStyle:{color:'#212121'}}, 'Tue', 'Wed',
'Thu', 'Fri', 'Sat', 'Sun']
   },
   yAxis: {
   type: 'value'
   },
   series: [{
   data: [820, 932, 901, 934, 1290, 1330, 1320],
   type: 'line'
   }]
   };

   ```

   ### Other comments [其他信息]


This is an automated message from the Apache Git Service.
To respond to the message, please log on GitHub and use the
URL above to go to the specific comment.

For queries about this service, please contact Infrastructure at:
us...@infra.apache.org


With regards,
Apache Git Services

-
To unsubscribe, e-mail: dev-unsubscr...@echarts.apache.org
For additional commands, e-mail: dev-h...@echarts.apache.org
[GitHub] wunayou commented on issue #8339: 一个很低级的BUG 折线图 单个name 文本的样式设置不了
wunayou commented on issue #8339: 一个很低级的BUG 折线图  单个name 文本的样式设置不了
URL:
https://github.com/apache/incubator-echarts/issues/8339#issuecomment-389067037


   没有找到 这个文件的位置 所以不能提PR了


This is an automated message from the Apache Git Service.
To respond to the message, please log on GitHub and use the
URL above to go to the specific comment.

For queries about this service, please contact Infrastructure at:
us...@infra.apache.org


With regards,
Apache Git Services

-
To unsubscribe, e-mail: dev-unsubscr...@echarts.apache.org
For additional commands, e-mail: dev-h...@echarts.apache.org
[GitHub] jeffmobiles opened a new issue #8341: svg render异常
jeffmobiles opened a new issue #8341: svg render异常
URL: https://github.com/apache/incubator-echarts/issues/8341


   ### One-line summary [问题简述]
   使用svg Render。 Option 的series的label没有rotate属性时。 只有设置rotate属性才不会报错。
   Uncaught TypeError: Cannot read property '0' of null
   at Object.t.rotate (matrix.js:99)
   at Y (graphic.js:415)
   at Object.S.brush (graphic.js:272)
   at S._paintList (Painter.js:163)
   at S.refresh (Painter.js:140)
   at m.refreshImmediately (zrender.js:237)
   at m.flush (zrender.js:264)
   at Object. (util.js:424)
   at s._update (Animation.js:159)
   at t (Animation.js:169)


   ### Version & Environment [版本及环境]
   + ECharts version [ECharts 版本]:4.1.0
   + Browser version [浏览器类型和版本]:
   + OS Version [操作系统类型和版本]:


   ### Expected behaviour [期望结果]


   ### ECharts option [ECharts配置项]


   ```javascript


   ECharts

   https://cdnjs.cloudflare.com/ajax/libs/echarts/4.1.0/echarts.min.js";>


  // 基于准备好的dom,初始化echarts实例theme, {renderer: render}
  var myChart = echarts.init(document.getElementById('main'), 'light',
{renderer: 'svg'});

   var option = {
"series": [{
"name": "数量",
"type": "pictorialBar",
"data": [42035, 41968, 41789, 41786, 41782, 41780, 41771,
41756, 41755, 41754],
"symbol": "circle",
"symbolSize": [8, 8],
"symbolRepeat": true,
"barGap": 0,
"xAxisIndex": 0,
"z": 5,
   "zlevel": 5,
"yAxisIndex": 0,
"itemStyle": {}
}, {
"name": "",
"type": "pictorialBar",
"data": [84070, 84070, 84070, 84070, 84070, 84070, 84070,
84070, 84070, 84070],
"symbol": "circle",
"symbolSize": [8, 8],
"symbolRepeat": true,
"barGap": "-100%",
"xAxisIndex": 0,
"z": 2,
"zlevel": 2,
"xAxisIndex": 0,
   "yAxisIndex": 0,
   label: {
 show: true,
 formatter: '{c}'
   },
"itemStyle": {
"show": true,
"opacity": 0.5,
"color": "rgba(255,255,255,.3)"
}
}],
"title": {
"text": "最近30分钟Class异常数Top 10",
"textStyle": {
"color": "#fff",
"fontSize": 12,
"fontWeight": "normal"
}
},
"xAxis": [{
"type": "value",
"show": false,
"position": "top",
"splitLine": {
"show": false
}
}],
"yAxis": [{
"type": "category",
"data": ["ender.H1", "H5.H2", "H3", "I4", "L5", "N7", "A75",
"P23", "H5.P8", "T9"],
"inverse": true,
"z": 10,
"zlevel": 10,
"splitLine": {
"show": false
},
"axisLabel": {
"show": true,
"inside": false,
"color": "#fff"
}
}],
"grid": [{
"containLabel": true,
"show": false,
"left": "5%",
"top": 20
}]
   }
 // 基于准备好的dom,初始化echarts实例
 myChart.setOption(option, true)


   ```


   ### Other comments [其他信息]


This is an automated message from the Apache Git Service.
To respond to the message, please log on GitHub and use the
URL above to go to the specific comment.

For queries about this service, please contact Infrastructure at:
us...@infra.apache.org


With regards,
Apache Git Services

-
To unsubscribe, e-mail: dev-unsubscr...@echarts.apache.org
For additional commands, e-mail: dev-h...@echarts.apache.org
[GitHub] eskimoblood opened a new issue #8342: How to make the yAxis line on to of bars
eskimoblood opened a new issue #8342: How to make the yAxis line on to of bars
URL: https://github.com/apache/incubator-echarts/issues/8342


   ### One-line summary [问题简述]

   The line of the yAxis lays under the bars in a horizontal bar chart by
default
(https://ecomfe.github.io/echarts-examples/public/editor.html?c=bar-y-category).
 Is there a way to make the bars start not on top but 1px to the right?


This is an automated message from the Apache Git Service.
To respond to the message, please log on GitHub and use the
URL above to go to the specific comment.

For queries about this service, please contact Infrastructure at:
us...@infra.apache.org


With regards,
Apache Git Services

-
To unsubscribe, e-mail: dev-unsubscr...@echarts.apache.org
For additional commands, e-mail: dev-h...@echarts.apache.org
[GitHub] Chrisyjs opened a new issue #8312: 配置项手册type: lines中的lineStyle.opacity.curveness错误
Chrisyjs opened a new issue #8312: 配置项手册type:
lines中的lineStyle.opacity.curveness错误
URL: https://github.com/apache/incubator-echarts/issues/8312


   ### One-line summary [问题简述]
   文档描述出错,type: lines中的lineStyle.opacity.curveness错误
   应该为lineStyle.opacity和lineStyle.curveness


   ### Version & Environment [版本及环境]
   + ECharts version [ECharts 版本]:
   + Browser version [浏览器类型和版本]:
   + OS Version [操作系统类型和版本]:


   ### Expected behaviour [期望结果]


   ### ECharts option [ECharts配置项]


   ```javascript
   option = {

   }

   ```


   ### Other comments [其他信息]


This is an automated message from the Apache Git Service.
To respond to the message, please log on GitHub and use the
URL above to go to the specific comment.

For queries about this service, please contact Infrastructure at:
us...@infra.apache.org


With regards,
Apache Git Services

-
To unsubscribe, e-mail: dev-unsubscr...@echarts.apache.org
For additional commands, e-mail: dev-h...@echarts.apache.org
[GitHub] zikuai commented on issue #8275: 4.x设置legend的宽度和高度不生效
zikuai commented on issue #8275: 4.x设置legend的宽度和高度不生效
URL:
https://github.com/apache/incubator-echarts/issues/8275#issuecomment-387588146


   @pissang 就是设置的宽度、高度不起作用,比如设置200的宽度,实际还是自适应的宽度


This is an automated message from the Apache Git Service.
To respond to the message, please log on GitHub and use the
URL above to go to the specific comment.

For queries about this service, please contact Infrastructure at:
us...@infra.apache.org


With regards,
Apache Git Services

-
To unsubscribe, e-mail: dev-unsubscr...@echarts.apache.org
For additional commands, e-mail: dev-h...@echarts.apache.org
[GitHub] chfw commented on issue #8270: 需要最新地图数据:地图下钻--全国/省/市-地图下钻--市县地图是旧的
chfw commented on issue #8270: 需要最新地图数据:地图下钻--全国/省/市-地图下钻--市县地图是旧的
URL:
https://github.com/apache/incubator-echarts/issues/8270#issuecomment-387648768


   用 https://github.com/echarts-maps/echarts-mapmaker 和 geojson.io 是可以自己做的。

   欢迎来参加:https://github.com/echarts-maps


This is an automated message from the Apache Git Service.
To respond to the message, please log on GitHub and use the
URL above to go to the specific comment.

For queries about this service, please contact Infrastructure at:
us...@infra.apache.org


With regards,
Apache Git Services

-
To unsubscribe, e-mail: dev-unsubscr...@echarts.apache.org
For additional commands, e-mail: dev-h...@echarts.apache.org
[GitHub] robinsoncrus0e commented on issue #3118: Incorrect get width of chart when container element' width is specified by %;
robinsoncrus0e commented on issue #3118: Incorrect get width of chart when
container element' width is specified by %;
URL:
https://github.com/apache/incubator-echarts/issues/3118#issuecomment-387691694


   This still seems to be an issue.  Has there been a fix implemented?


This is an automated message from the Apache Git Service.
To respond to the message, please log on GitHub and use the
URL above to go to the specific comment.

For queries about this service, please contact Infrastructure at:
us...@infra.apache.org


With regards,
Apache Git Services

-
To unsubscribe, e-mail: dev-unsubscr...@echarts.apache.org
For additional commands, e-mail: dev-h...@echarts.apache.org
[GitHub] gaoshijun1993 opened a new issue #8313: Feature: tree 增加直角线条功能
gaoshijun1993 opened a new issue #8313: Feature: tree 增加直角线条功能
URL: https://github.com/apache/incubator-echarts/issues/8313


   树形图会经常用于组织机构的展现,对于组织机构的展现一般用直角的线条会比较合适,但是目前tree
的节点线条都是平滑的,所以希望能够增加直角的线条展现配置功能


This is an automated message from the Apache Git Service.
To respond to the message, please log on GitHub and use the
URL above to go to the specific comment.

For queries about this service, please contact Infrastructure at:
us...@infra.apache.org


With regards,
Apache Git Services

-
To unsubscribe, e-mail: dev-unsubscr...@echarts.apache.org
For additional commands, e-mail: dev-h...@echarts.apache.org
[GitHub] lvybriage opened a new issue #8304: parallel图渲染问题
lvybriage opened a new issue #8304: parallel图渲染问题
URL: https://github.com/apache/incubator-echarts/issues/8304


   ### One-line summary [问题简述]
   parallel图中,最简单的平行图里,如果设置 smooth: true的话,渲染的时候,会出现先后渲染,最后才会渲染轴线顶部的线条。


   ### Version & Environment [版本及环境]
   + ECharts version [ECharts 版本]:  "echarts": "^4.0.2", "echarts-for-react":
"^2.0.8",
   + Browser version [浏览器类型和版本]: 谷歌浏览器
   + OS Version [操作系统类型和版本]:


   ### Expected behaviour [期望结果]

   同步渲染,而不是有先后。


   ### ECharts option [ECharts配置项]


   ```javascript
   option = {
   parallelAxis: [
   {dim: 0, name: 'Price'},
   {dim: 1, max: 1028,name: 'eight'},
   {dim: 2, name: 'Amount'},
   {
   dim: 3,
   name: 'Score',
   type: 'category',
   data: ['Excellent', 'Good', 'OK', 'Bad']
   }
   ],
   series: {
   type: 'parallel',
   smooth: true,
   lineStyle: {
   width: 4
   },
   data: [
   [12.99, 100, 82, 'Good'],
   [9.99, 80, 77, 'OK'],
   [20, 1024, 60, 'Excellent']
   ]
   }
   };

   ```


   ### Other comments [其他信息]

   刚开始渲染的时候,20 1028这段并没有渲染,而是在整个图完成之后最后渲染的。

   option中去掉 smooth: true 这个属性就没这个问题了。

   但是因为需求,我们需要平滑的曲线。

   求大神支招。


This is an automated message from the Apache Git Service.
To respond to the message, please log on GitHub and use the
URL above to go to the specific comment.

For queries about this service, please contact Infrastructure at:
us...@infra.apache.org


With regards,
Apache Git Services

-
To unsubscribe, e-mail: dev-unsubscr...@echarts.apache.org
For additional commands, e-mail: dev-h...@echarts.apache.org
[GitHub] maicss opened a new issue #8300: [功能][折线]能不能在一条折线的最后指定的范围内显示成虚线?
maicss opened a new issue #8300: [功能][折线]能不能在一条折线的最后指定的范围内显示成虚线?
URL: https://github.com/apache/incubator-echarts/issues/8300


   类似于做预测的那种图,再在一段实线的折线末端,有一段虚线的折线。

   配置项的markArea、markItem、markLine,还有visualMap的pieces都不能做到这种效果。


This is an automated message from the Apache Git Service.
To respond to the message, please log on GitHub and use the
URL above to go to the specific comment.

For queries about this service, please contact Infrastructure at:
us...@infra.apache.org


With regards,
Apache Git Services

-
To unsubscribe, e-mail: dev-unsubscr...@echarts.apache.org
For additional commands, e-mail: dev-h...@echarts.apache.org
[GitHub] qingbopro commented on issue #8301: radar无法显示刻度,报错
qingbopro commented on issue #8301: radar无法显示刻度,报错
URL:
https://github.com/apache/incubator-echarts/issues/8301#issuecomment-387266058


   http://echarts.baidu.com/examples/editor.html?c=radar


This is an automated message from the Apache Git Service.
To respond to the message, please log on GitHub and use the
URL above to go to the specific comment.

For queries about this service, please contact Infrastructure at:
us...@infra.apache.org


With regards,
Apache Git Services

-
To unsubscribe, e-mail: dev-unsubscr...@echarts.apache.org
For additional commands, e-mail: dev-h...@echarts.apache.org
[GitHub] pissang commented on issue #8282: When rendering as SVG, throw Error: attribute transform: Expected number, "rotate(NaN,111.68400 000…".
pissang commented on issue #8282: When rendering as SVG, throw Error:
attribute transform: Expected number, "rotate(NaN,111.68400 000…".
URL:
https://github.com/apache/incubator-echarts/issues/8282#issuecomment-387280861


   最新的 rc 版本中应该已经修复这个问题


This is an automated message from the Apache Git Service.
To respond to the message, please log on GitHub and use the
URL above to go to the specific comment.

For queries about this service, please contact Infrastructure at:
us...@infra.apache.org


With regards,
Apache Git Services

-
To unsubscribe, e-mail: dev-unsubscr...@echarts.apache.org
For additional commands, e-mail: dev-h...@echarts.apache.org
[GitHub] pissang closed issue #8274: Uncaught TypeError: Cannot read property axisData' of undefined
pissang closed issue #8274: Uncaught TypeError: Cannot read property axisData'
of undefined
URL: https://github.com/apache/incubator-echarts/issues/8274


This is an automated message from the Apache Git Service.
To respond to the message, please log on GitHub and use the
URL above to go to the specific comment.

For queries about this service, please contact Infrastructure at:
us...@infra.apache.org


With regards,
Apache Git Services

-
To unsubscribe, e-mail: dev-unsubscr...@echarts.apache.org
For additional commands, e-mail: dev-h...@echarts.apache.org
[GitHub] pissang commented on issue #8272: un解绑函数不生效
pissang commented on issue #8272: un解绑函数不生效
URL:
https://github.com/apache/incubator-echarts/issues/8272#issuecomment-387283187


   使用 3+ 版本的 echarts,用 off 解绑


This is an automated message from the Apache Git Service.
To respond to the message, please log on GitHub and use the
URL above to go to the specific comment.

For queries about this service, please contact Infrastructure at:
us...@infra.apache.org


With regards,
Apache Git Services

-
To unsubscribe, e-mail: dev-unsubscr...@echarts.apache.org
For additional commands, e-mail: dev-h...@echarts.apache.org
[GitHub] pissang closed issue #8272: un解绑函数不生效
pissang closed issue #8272: un解绑函数不生效
URL: https://github.com/apache/incubator-echarts/issues/8272


This is an automated message from the Apache Git Service.
To respond to the message, please log on GitHub and use the
URL above to go to the specific comment.

For queries about this service, please contact Infrastructure at:
us...@infra.apache.org


With regards,
Apache Git Services

-
To unsubscribe, e-mail: dev-unsubscr...@echarts.apache.org
For additional commands, e-mail: dev-h...@echarts.apache.org
[GitHub] pissang commented on issue #8270: 需要最新地图数据:地图下钻--全国/省/市-地图下钻--市县地图是旧的
pissang commented on issue #8270: 需要最新地图数据:地图下钻--全国/省/市-地图下钻--市县地图是旧的
URL:
https://github.com/apache/incubator-echarts/issues/8270#issuecomment-387283256


   我们短期内不再提供地图数据


This is an automated message from the Apache Git Service.
To respond to the message, please log on GitHub and use the
URL above to go to the specific comment.

For queries about this service, please contact Infrastructure at:
us...@infra.apache.org


With regards,
Apache Git Services

-
To unsubscribe, e-mail: dev-unsubscr...@echarts.apache.org
For additional commands, e-mail: dev-h...@echarts.apache.org
[GitHub] igloooooo commented on issue #8087: 折线设置showSymbol为false,label无法显示
igloo commented on issue #8087: 折线设置showSymbol为false,label无法显示
URL:
https://github.com/apache/incubator-echarts/issues/8087#issuecomment-387287253


   any update for this?


This is an automated message from the Apache Git Service.
To respond to the message, please log on GitHub and use the
URL above to go to the specific comment.

For queries about this service, please contact Infrastructure at:
us...@infra.apache.org


With regards,
Apache Git Services

-
To unsubscribe, e-mail: dev-unsubscr...@echarts.apache.org
For additional commands, e-mail: dev-h...@echarts.apache.org
[GitHub] pissang commented on issue #8293: getDataURL的api获取的base64中,没有包含柱状的图形
pissang commented on issue #8293: getDataURL的api获取的base64中,没有包含柱状的图形
URL:
https://github.com/apache/incubator-echarts/issues/8293#issuecomment-387281574


   去掉 animation 试试


This is an automated message from the Apache Git Service.
To respond to the message, please log on GitHub and use the
URL above to go to the specific comment.

For queries about this service, please contact Infrastructure at:
us...@infra.apache.org


With regards,
Apache Git Services

-
To unsubscribe, e-mail: dev-unsubscr...@echarts.apache.org
For additional commands, e-mail: dev-h...@echarts.apache.org
[GitHub] pissang commented on issue #8275: 4.x设置legend的宽度和高度不生效
pissang commented on issue #8275: 4.x设置legend的宽度和高度不生效
URL:
https://github.com/apache/incubator-echarts/issues/8275#issuecomment-387282835


   不生效指的是什么?


This is an automated message from the Apache Git Service.
To respond to the message, please log on GitHub and use the
URL above to go to the specific comment.

For queries about this service, please contact Infrastructure at:
us...@infra.apache.org


With regards,
Apache Git Services

-
To unsubscribe, e-mail: dev-unsubscr...@echarts.apache.org
For additional commands, e-mail: dev-h...@echarts.apache.org
[GitHub] pissang commented on issue #8280: Echars Galery中的项目怎么下载
pissang commented on issue #8280: Echars Galery中的项目怎么下载
URL:
https://github.com/apache/incubator-echarts/issues/8280#issuecomment-387282909


   可以按照入门教程建好项目后把 option 下下来替换


This is an automated message from the Apache Git Service.
To respond to the message, please log on GitHub and use the
URL above to go to the specific comment.

For queries about this service, please contact Infrastructure at:
us...@infra.apache.org


With regards,
Apache Git Services

-
To unsubscribe, e-mail: dev-unsubscr...@echarts.apache.org
For additional commands, e-mail: dev-h...@echarts.apache.org
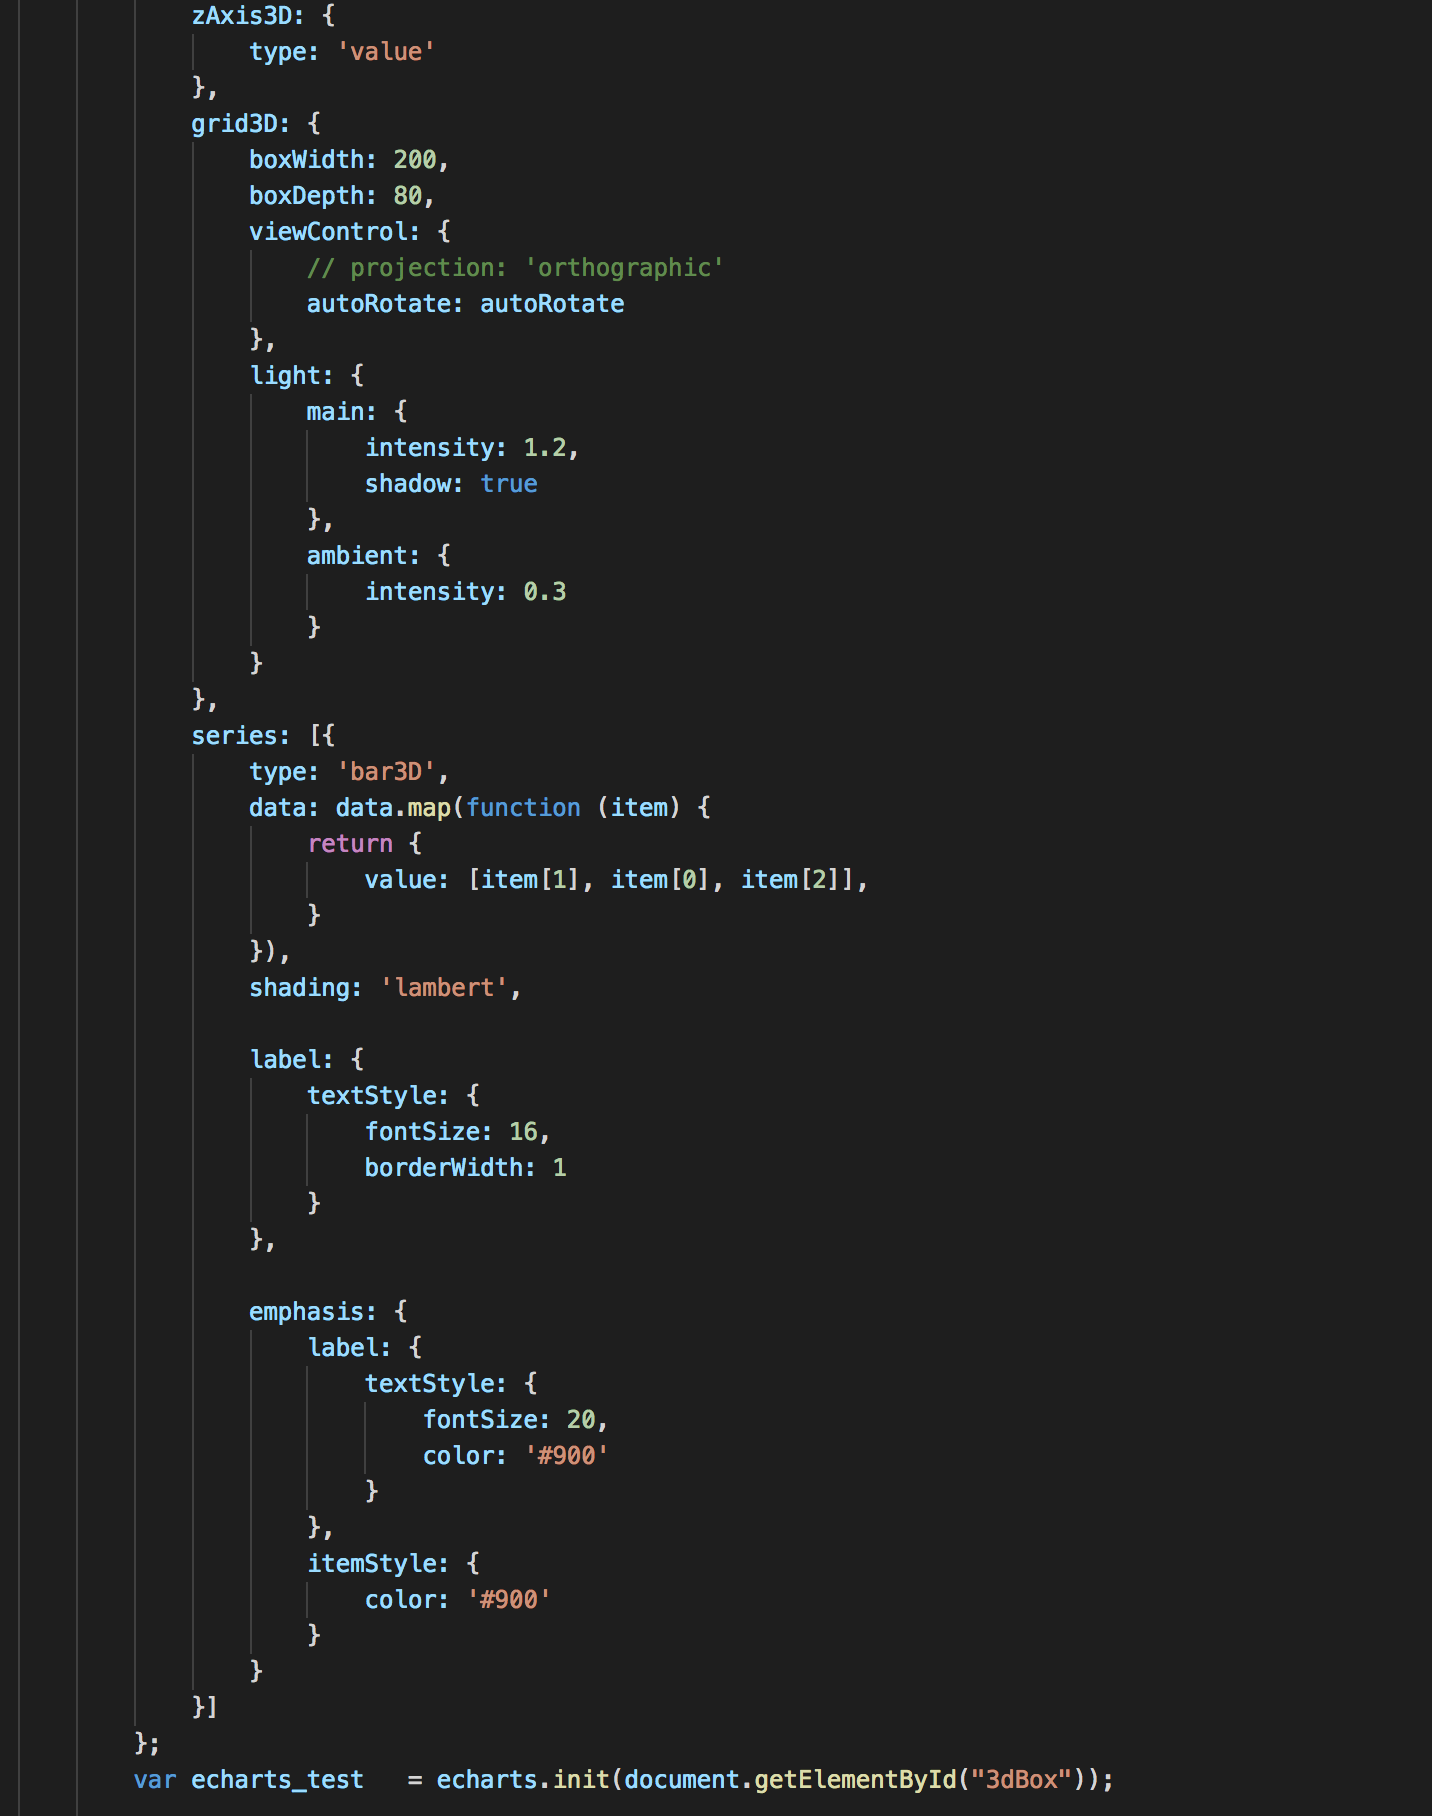
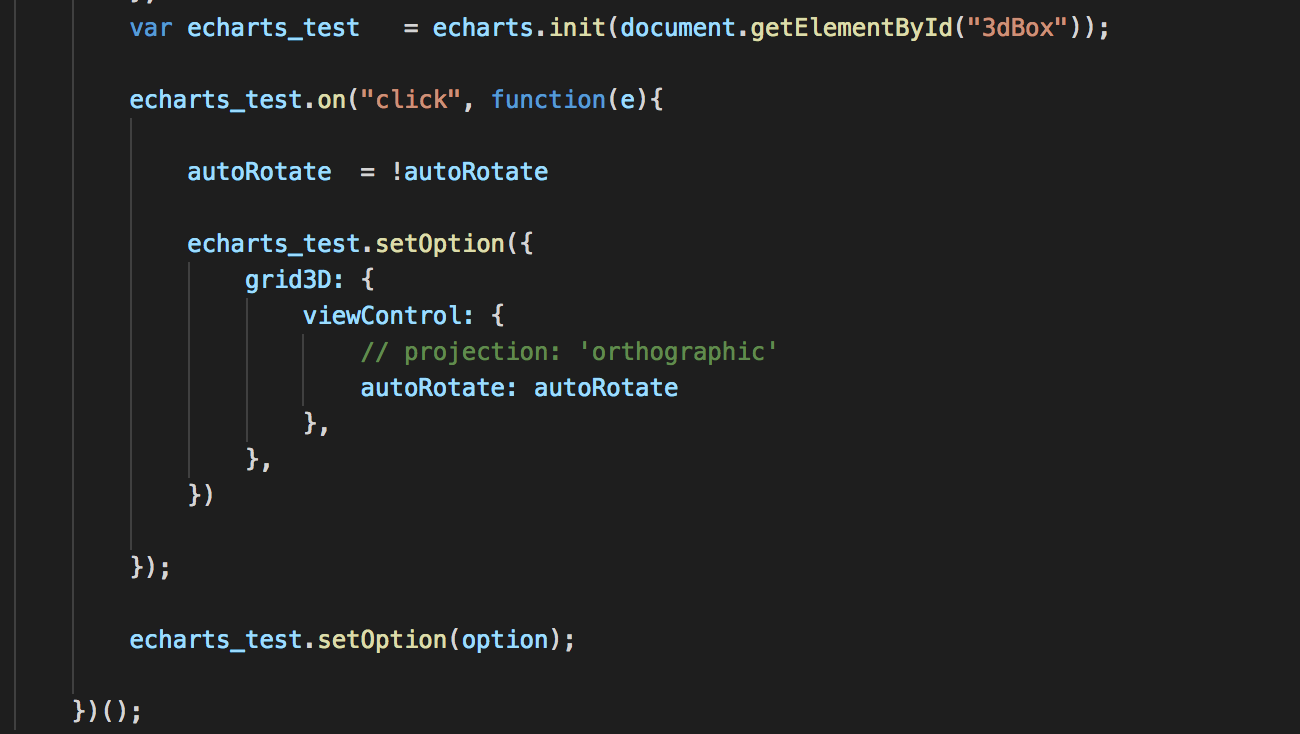
[GitHub] sunNnus opened a new issue #8302: 手动关闭 3D 柱形图的自动旋转效果,在恢复自动旋转的间隔内失效
sunNnus opened a new issue #8302: 手动关闭 3D 柱形图的自动旋转效果,在恢复自动旋转的间隔内失效
URL: https://github.com/apache/incubator-echarts/issues/8302
### One-line summary [问题简述]
开启 3D 柱形图的自动旋转效果,3D
柱形图在受到迟滞因子(旋转,缩放等操作)时停止,然后会有一个恢复自动旋转的时间间隔,如果在这个间隔内手动禁止自动旋转效果时会失效
### Version & Environment [版本及环境]
+ ECharts version [ECharts 版本]: 3.7.3 (echarts-gl 1.0.2)
+ Browser version [浏览器类型和版本]: chrome 66.0.3359.139
+ OS Version [操作系统类型和版本]: macOS 10.12.6
### Expected behaviour [期望结果]
无论在什么时候只要手动禁止 3D 柱形图时都不会再自动旋转
### ECharts option [ECharts配置项]
```javascript
option = {
tooltip: {},
visualMap: {
max: 20,
inRange: {
color: ['#313695', '#4575b4', '#74add1', '#abd9e9',
'#e0f3f8', '#bf', '#fee090', '#fdae61', '#f46d43', '#d73027', '#a50026']
}
},
xAxis3D: {
type: 'category',
data: hours
},
yAxis3D: {
type: 'category',
data: days
},
zAxis3D: {
type: 'value'
},
grid3D: {
boxWidth: 200,
boxDepth: 80,
viewControl: {
autoRotate: true
},
light: {
main: {
intensity: 1.2,
shadow: true
},
ambient: {
intensity: 0.3
}
}
},
series: [{
type: 'bar3D',
data: data.map(function (item) {
return {
value: [item[1], item[0], item[2]],
}
}),
shading: 'lambert',
label: {
textStyle: {
fontSize: 16,
borderWidth: 1
}
},
emphasis: {
label: {
textStyle: {
fontSize: 20,
color: '#900'
}
},
itemStyle: {
color: '#900'
}
}
}]
};
```
### Other comments [其他信息]
This is an automated message from the Apache Git Service.
To respond to the message, please log on GitHub and use the
URL above to go to the specific comment.
For queries about this service, please contact Infrastructure at:
us...@infra.apache.org
With regards,
Apache Git Services
-
To unsubscribe, e-mail: dev-unsubscr...@echarts.apache.org
For additional commands, e-mail: dev-h...@echarts.apache.org
[GitHub] pissang commented on issue #8280: Echars Galery中的项目怎么下载
pissang commented on issue #8280: Echars Galery中的项目怎么下载
URL:
https://github.com/apache/incubator-echarts/issues/8280#issuecomment-387282909


   可以按照入门教程建好项目后把 gallery 里的 option 下下来替换


This is an automated message from the Apache Git Service.
To respond to the message, please log on GitHub and use the
URL above to go to the specific comment.

For queries about this service, please contact Infrastructure at:
us...@infra.apache.org


With regards,
Apache Git Services

-
To unsubscribe, e-mail: dev-unsubscr...@echarts.apache.org
For additional commands, e-mail: dev-h...@echarts.apache.org
[GitHub] sma11tu commented on issue #7331: geo3d坐标下,lines3D和bar3D 可以共存吗?
sma11tu commented on issue #7331: geo3d坐标下,lines3D和bar3D 可以共存吗?
URL:
https://github.com/apache/incubator-echarts/issues/7331#issuecomment-387291112


   @KurryLuo 我一直也没解决,遇到这个问题后,就没再做这个,今天下班后用你的方法试试


This is an automated message from the Apache Git Service.
To respond to the message, please log on GitHub and use the
URL above to go to the specific comment.

For queries about this service, please contact Infrastructure at:
us...@infra.apache.org


With regards,
Apache Git Services

-
To unsubscribe, e-mail: dev-unsubscr...@echarts.apache.org
For additional commands, e-mail: dev-h...@echarts.apache.org
[GitHub] pissang closed issue #8290: 如何绘制自定义对象
pissang closed issue #8290: 如何绘制自定义对象
URL: https://github.com/apache/incubator-echarts/issues/8290


This is an automated message from the Apache Git Service.
To respond to the message, please log on GitHub and use the
URL above to go to the specific comment.

For queries about this service, please contact Infrastructure at:
us...@infra.apache.org


With regards,
Apache Git Services

-
To unsubscribe, e-mail: dev-unsubscr...@echarts.apache.org
For additional commands, e-mail: dev-h...@echarts.apache.org
[GitHub] pissang commented on issue #8288: Google charts: timelines [question]
pissang commented on issue #8288: Google charts: timelines [question]
URL:
https://github.com/apache/incubator-echarts/issues/8288#issuecomment-387282472


   You can use `custom` series to implement this. Like what this example do.
https://ecomfe.github.io/echarts-examples/public/editor.html?c=custom-profile


This is an automated message from the Apache Git Service.
To respond to the message, please log on GitHub and use the
URL above to go to the specific comment.

For queries about this service, please contact Infrastructure at:
us...@infra.apache.org


With regards,
Apache Git Services

-
To unsubscribe, e-mail: dev-unsubscr...@echarts.apache.org
For additional commands, e-mail: dev-h...@echarts.apache.org
[GitHub] pissang commented on issue #8282: When rendering as SVG, throw Error: attribute transform: Expected number, "rotate(NaN,111.68400 000…".
pissang commented on issue #8282: When rendering as SVG, throw Error:
attribute transform: Expected number, "rotate(NaN,111.68400 000…".
URL:
https://github.com/apache/incubator-echarts/issues/8282#issuecomment-387281018


   @TonyChanNJU Can you show us the error in 4.1.0 ?


This is an automated message from the Apache Git Service.
To respond to the message, please log on GitHub and use the
URL above to go to the specific comment.

For queries about this service, please contact Infrastructure at:
us...@infra.apache.org


With regards,
Apache Git Services

-
To unsubscribe, e-mail: dev-unsubscr...@echarts.apache.org
For additional commands, e-mail: dev-h...@echarts.apache.org
[GitHub] pissang commented on issue #8240: series.graph使用 coordinateSystem: 'cartesian2d'时, 无法显示data 和 edges
pissang commented on issue #8240: series.graph使用 coordinateSystem:
'cartesian2d'时, 无法显示data 和 edges
URL:
https://github.com/apache/incubator-echarts/issues/8240#issuecomment-387283533


   应该写成
   ```js

 data:  [
   {
 value: [100, 200],
 id: 'A'
   },
   {
 value: [400, 300],
 id: 'B'
   }
 ],
   ```

   x, y 不是在笛卡尔坐标系上用的


This is an automated message from the Apache Git Service.
To respond to the message, please log on GitHub and use the
URL above to go to the specific comment.

For queries about this service, please contact Infrastructure at:
us...@infra.apache.org


With regards,
Apache Git Services

-
To unsubscribe, e-mail: dev-unsubscr...@echarts.apache.org
For additional commands, e-mail: dev-h...@echarts.apache.org
[GitHub] pissang closed issue #8240: series.graph使用 coordinateSystem: 'cartesian2d'时, 无法显示data 和 edges
pissang closed issue #8240: series.graph使用 coordinateSystem: 'cartesian2d'时,
无法显示data 和 edges
URL: https://github.com/apache/incubator-echarts/issues/8240


This is an automated message from the Apache Git Service.
To respond to the message, please log on GitHub and use the
URL above to go to the specific comment.

For queries about this service, please contact Infrastructure at:
us...@infra.apache.org


With regards,
Apache Git Services

-
To unsubscribe, e-mail: dev-unsubscr...@echarts.apache.org
For additional commands, e-mail: dev-h...@echarts.apache.org
[GitHub] qingbopro opened a new issue #8301: radar无法显示刻度,报错
qingbopro opened a new issue #8301: radar无法显示刻度,报错
URL: https://github.com/apache/incubator-echarts/issues/8301


   ### One-line summary [问题简述]
   使用type为radar时,无法显示刻度。
   axisLabel: {
 show: true   设置为false才行
   },

   TypeError: axisModel.getCategories is not a function
   at buildAxisLabel (eval at  (reportpreviews.js:1296),
:556:35)
   at AxisBuilder.axisTickLabel (eval at
(reportpreviews.js:1296), :235:20)
   at AxisBuilder.add (eval at  (reportpreviews.js:1296),
:137:20)
   at Array.forEach ()
   at Object.each (eval at  (reportpreviews.js:594),
:298:9)
   at ExtendedClass.eval (eval at  (reportpreviews.js:3248),
:57:14)
   at Array.forEach ()
   at Object.each (eval at  (reportpreviews.js:594),
:298:9)
   at ExtendedClass._buildAxes (eval at
(reportpreviews.js:3248), :56:12)
   at ExtendedClass.render (eval at  (reportpreviews.js:3248),
:39:10)

   ```javascript
   option = {
   title: {
   text: '基础雷达图'
   },
   tooltip: {},
   legend: {
   data: ['预算分配(Allocated Budget)', '实际开销(Actual Spending)']
   },
   radar: {
   // shape: 'circle',
   name: {
   textStyle: {
   color: '#fff',
   backgroundColor: '#999',
   borderRadius: 3,
   padding: [3, 5]
  }
   },
   axisLabel: {
 show: true
   },
   indicator: [
  { name: '销售(sales)', max: 6500},
  { name: '管理(Administration)', max: 16000},
  { name: '信息技术(Information Techology)', max: 3},
  { name: '客服(Customer Support)', max: 38000},
  { name: '研发(Development)', max: 52000},
  { name: '市场(Marketing)', max: 25000}
   ]
   },
   series: [{
   name: '预算 vs 开销(Budget vs spending)',
   type: 'radar',
   // areaStyle: {normal: {}},
   data : [
   {
   value : [4300, 1, 28000, 35000, 5, 19000],
   name : '预算分配(Allocated Budget)'
   },
{
   value : [5000, 14000, 28000, 31000, 42000, 21000],
   name : '实际开销(Actual Spending)'
   }
   ]
   }]
   };
   ```


   ### Version & Environment [版本及环境]
   + ECharts version [ECharts 版本]:
   + Browser version [浏览器类型和版本]:
   + OS Version [操作系统类型和版本]:


   ### Expected behaviour [期望结果]


   ### ECharts option [ECharts配置项]


   ```javascript
   option = {

   }

   ```


   ### Other comments [其他信息]


This is an automated message from the Apache Git Service.
To respond to the message, please log on GitHub and use the
URL above to go to the specific comment.

For queries about this service, please contact Infrastructure at:
us...@infra.apache.org


With regards,
Apache Git Services

-
To unsubscribe, e-mail: dev-unsubscr...@echarts.apache.org
For additional commands, e-mail: dev-h...@echarts.apache.org
[GitHub] qingbopro commented on issue #8301: radar无法显示刻度,报错
qingbopro commented on issue #8301: radar无法显示刻度,报错
URL:
https://github.com/apache/incubator-echarts/issues/8301#issuecomment-387266007


   版本 4.1.0


This is an automated message from the Apache Git Service.
To respond to the message, please log on GitHub and use the
URL above to go to the specific comment.

For queries about this service, please contact Infrastructure at:
us...@infra.apache.org


With regards,
Apache Git Services

-
To unsubscribe, e-mail: dev-unsubscr...@echarts.apache.org
For additional commands, e-mail: dev-h...@echarts.apache.org
[GitHub] pissang commented on issue #8291: 如何实现实现地图作为背景,高亮中国地图
pissang commented on issue #8291: 如何实现实现地图作为背景,高亮中国地图
URL:
https://github.com/apache/incubator-echarts/issues/8291#issuecomment-387282014


   可以在世界地图上再叠加一个中国地图


This is an automated message from the Apache Git Service.
To respond to the message, please log on GitHub and use the
URL above to go to the specific comment.

For queries about this service, please contact Infrastructure at:
us...@infra.apache.org


With regards,
Apache Git Services

-
To unsubscribe, e-mail: dev-unsubscr...@echarts.apache.org
For additional commands, e-mail: dev-h...@echarts.apache.org
[GitHub] pissang commented on issue #8303: 饼图标签在SVG渲染模式下使用富文本显示异常
pissang commented on issue #8303: 饼图标签在SVG渲染模式下使用富文本显示异常
URL:
https://github.com/apache/incubator-echarts/issues/8303#issuecomment-387295427


   SVG 渲染暂时还不支持富文本标签


This is an automated message from the Apache Git Service.
To respond to the message, please log on GitHub and use the
URL above to go to the specific comment.

For queries about this service, please contact Infrastructure at:
us...@infra.apache.org


With regards,
Apache Git Services

-
To unsubscribe, e-mail: dev-unsubscr...@echarts.apache.org
For additional commands, e-mail: dev-h...@echarts.apache.org
[GitHub] jeffmobiles commented on issue #8311: 使用svg 渲染, 编译压缩之后出现了Cannot read property '0' of null
jeffmobiles commented on issue #8311: 使用svg 渲染, 编译压缩之后出现了Cannot read property
'0' of null
URL:
https://github.com/apache/incubator-echarts/issues/8311#issuecomment-387617224


   虽然 4.0.3之后修改了。
   var rotate = -style.textRotation || 0;
   var transform = matrix.create(); // Apply textRotate to element matrix

   matrix.rotate(transform, el.transform, rotate);
   setTransform(textSvgEl, transform);
   但是el.transform为空也还报错。。。
   so


This is an automated message from the Apache Git Service.
To respond to the message, please log on GitHub and use the
URL above to go to the specific comment.

For queries about this service, please contact Infrastructure at:
us...@infra.apache.org


With regards,
Apache Git Services

-
To unsubscribe, e-mail: dev-unsubscr...@echarts.apache.org
For additional commands, e-mail: dev-h...@echarts.apache.org
[GitHub] xccxcs commented on issue #8279: graph symbol 图片取不到的时候 怎么使用默认图片代替
xccxcs commented on issue #8279: graph symbol 图片取不到的时候 怎么使用默认图片代替
URL:
https://github.com/apache/incubator-echarts/issues/8279#issuecomment-387599437


   但是这样不应该先把图片全部请求好才能进行下去吗


This is an automated message from the Apache Git Service.
To respond to the message, please log on GitHub and use the
URL above to go to the specific comment.

For queries about this service, please contact Infrastructure at:
us...@infra.apache.org


With regards,
Apache Git Services

-
To unsubscribe, e-mail: dev-unsubscr...@echarts.apache.org
For additional commands, e-mail: dev-h...@echarts.apache.org
[GitHub] LonHon commented on issue #8277: xAxis.type='time' + zoomData时卡顿问题
LonHon commented on issue #8277: xAxis.type='time' + zoomData时卡顿问题
URL:
https://github.com/apache/incubator-echarts/issues/8277#issuecomment-387601066


   @pissang  虽然个人已经解决卡顿问题,还是放上option供你们去寻找原因。

   官方demo: http://echarts.baidu.com/examples/editor.html?c=dynamic-data2

   电脑配置是小米pro顶配,在数据量4000时会明显卡顿,应该是渲染 series ** showSymbol, hoverAnimation **
存在问题

   代码
   ```
   function randomData() {
   now = new Date(+now + oneDay);
   value = value + Math.random() * 21 - 10;
   return {
   name: now.toString(),
   value: [
   [now.getFullYear(), now.getMonth() + 1, now.getDate()].join('/'),
   Math.round(value)
   ]
   }
   }

   var data = [], data1 = [], timeline = [];
   var now = +new Date(1997, 9, 3);
   var oneDay = 24 * 3600 * 1000;
   var value = Math.random() * 1000;
   for (var i = 0; i < 4000; i++) {
   data.push(randomData());
   }

   option = {
   title: {
   text: '动态数据 + 时间坐标轴'
   },
   tooltip: {
   trigger: 'axis'
   },
   xAxis: {
   type: 'time'
   },
   yAxis: [{
   type: 'value',
   boundaryGap: [0, '100%']
   },{
   type: 'value',
   boundaryGap: [0, '100%']
   }],
   series: [{
   name: '模拟数据',
   type: 'line',
   data: data
   }],
   };
   ```


This is an automated message from the Apache Git Service.
To respond to the message, please log on GitHub and use the
URL above to go to the specific comment.

For queries about this service, please contact Infrastructure at:
us...@infra.apache.org


With regards,
Apache Git Services

-
To unsubscribe, e-mail: dev-unsubscr...@echarts.apache.org
For additional commands, e-mail: dev-h...@echarts.apache.org
[GitHub] LonHon opened a new issue #8277: xAxis.type='time' + zoomData时卡顿问题
LonHon opened a new issue #8277: xAxis.type='time' + zoomData时卡顿问题
URL: https://github.com/apache/incubator-echarts/issues/8277


   ### One-line summary [问题简述]
   @pissang
   使用折线图   series.length为2

   已设置animation: false

   xAxis.type='time' + zoomData时,目前1000条数据,当全部展示时卡顿比较严重,较小范围展示内存占用增加了100M。

   同样的数据 xAxis.type='category'  时十分流畅。


   ### Version & Environment [版本及环境]
   + ECharts version [ECharts 版本]: 4.0.4
   + Browser version [浏览器类型和版本]: Chrome 65.0.3325.162
   + OS Version [操作系统类型和版本]:
   小米pro 16G win10


   ### Expected behaviour [期望结果]

   卡顿效果能够优化


   ### ECharts option [ECharts配置项]


   ```javascript
   option = {

   }

   ```


   ### Other comments [其他信息]


This is an automated message from the Apache Git Service.
To respond to the message, please log on GitHub and use the
URL above to go to the specific comment.

For queries about this service, please contact Infrastructure at:
us...@infra.apache.org


With regards,
Apache Git Services

-
To unsubscribe, e-mail: dev-unsubscr...@echarts.apache.org
For additional commands, e-mail: dev-h...@echarts.apache.org
[GitHub] renrenguiwei commented on issue #8308: echart地图每个省显示时,可以做到一个个逐个显示动画吗?
renrenguiwei commented on issue #8308: echart地图每个省显示时,可以做到一个个逐个显示动画吗?
URL:
https://github.com/apache/incubator-echarts/issues/8308#issuecomment-387589185


   可能需要二次开发了!


This is an automated message from the Apache Git Service.
To respond to the message, please log on GitHub and use the
URL above to go to the specific comment.

For queries about this service, please contact Infrastructure at:
us...@infra.apache.org


With regards,
Apache Git Services

-
To unsubscribe, e-mail: dev-unsubscr...@echarts.apache.org
For additional commands, e-mail: dev-h...@echarts.apache.org
[GitHub] chenwr727 opened a new issue #8310: 多坐标下,x轴为类目时,magicType切换'line',各坐标boundaryGap不一致
chenwr727 opened a new issue #8310:
多坐标下,x轴为类目时,magicType切换'line',各坐标boundaryGap不一致
URL: https://github.com/apache/incubator-echarts/issues/8310
### One-line summary [问题简述]
多坐标下,x轴为类目时,magicType切换'line',各坐标boundaryGap不一致
### Version & Environment [版本及环境]
+ ECharts version [ECharts 版本]:v4.1.0.rc2
+ Browser version [浏览器类型和版本]:chrome
+ OS Version [操作系统类型和版本]:win7
### Expected behaviour [期望结果]
### ECharts option [ECharts配置项]
```javascript
option = {
toolbox:{
feature:{
magicType:{
type: ['line', 'bar']
},
restore:{},
saveAsImage:{}
}
},
grid:[{
bottom: '55%'
},{
top: '55%'
}],
xAxis: [{
type: 'category',
gridIndex: 0,
data: ['Mon', 'Tue', 'Wed', 'Thu', 'Fri', 'Sat', 'Sun']
},{
type: 'category',
gridIndex: 1,
data: ['Mon', 'Tue', 'Wed', 'Thu', 'Fri', 'Sat', 'Sun']
}],
yAxis: [{
type: 'value',
gridIndex: 0,
},{
type: 'value',
gridIndex: 1,
}],
series: [{
xAxisIndex: 0,
yAxisIndex: 0,
data: [820, 932, 901, 934, 1290, 1330, 1320],
type: 'line'
},
{
xAxisIndex: 1,
yAxisIndex: 1,
data: [820, 932, 901, 934, 1290, 1330, 1320],
type: 'line'
}]
};
```
### Other comments [其他信息]
This is an automated message from the Apache Git Service.
To respond to the message, please log on GitHub and use the
URL above to go to the specific comment.
For queries about this service, please contact Infrastructure at:
us...@infra.apache.org
With regards,
Apache Git Services
-
To unsubscribe, e-mail: dev-unsubscr...@echarts.apache.org
For additional commands, e-mail: dev-h...@echarts.apache.org
[GitHub] pissang commented on issue #8291: 如何实现实现地图作为背景,高亮中国地图
pissang commented on issue #8291: 如何实现实现地图作为背景,高亮中国地图
URL:
https://github.com/apache/incubator-echarts/issues/8291#issuecomment-387314862


   用两个地图系列,然后设置相同的 boundingCoords 保证能够对其


This is an automated message from the Apache Git Service.
To respond to the message, please log on GitHub and use the
URL above to go to the specific comment.

For queries about this service, please contact Infrastructure at:
us...@infra.apache.org


With regards,
Apache Git Services

-
To unsubscribe, e-mail: dev-unsubscr...@echarts.apache.org
For additional commands, e-mail: dev-h...@echarts.apache.org
[GitHub] surui0419 opened a new issue #8305: echarts GL中,怎么改变type:'lines3D'的三维飞线距离三维地理坐标系表面的距离
surui0419 opened a new issue #8305: echarts
GL中,怎么改变type:'lines3D'的三维飞线距离三维地理坐标系表面的距离
URL: https://github.com/apache/incubator-echarts/issues/8305
### One-line summary [问题简述]
使用echarts
GL绘制了一个3D的地球,通过type:‘lines3D'绘制了一条跨越大半个地球的飞线,因为两个点的跨越幅度很大,导致这条3D飞线绘制出来离地球表面很远的距离,怎么通过设置让这条飞线离地球表面距离近一点
### Version & Environment [版本及环境]
+ ECharts version [ECharts 版本]:
claygl, version 1.2.1
echarts, version 4.1.0
+ Browser version [浏览器类型和版本]:
Chrome
+ OS Version [操作系统类型和版本]:
win10
### Expected behaviour [期望结果]
期望能够调整3d飞线距离地球表面的距离
### ECharts option [ECharts配置项]
```javascript
option = {
globe: {
left: 0,
right: '8%',
top: '4.5%',
bottom: 0,
baseTexture: world, // 地球的纹理,支持图片或canvas对象或echarts实例作为纹理
shading: "color", // 不受光照影响
viewControl: {// 用于鼠标的旋转缩放控制
zoomSensitivity: 0, // 缩放灵敏度 0关闭缩放
rotateSensitivity: [2,0], //控制横、纵旋转灵敏度
autoRotate: true, // 控制地球是否自转
autoRotateDirection: "ccw", //控制自转方向
autoRotateAfterStill: 4,
autoRotateSpeed:10
}
},
series: {
type: 'lines3D',
coordinateSystem: 'globe',
blendMode: 'lighter',
effect: { // 飞线 特效
show: true,
peroid: 2,
trailColor: 'greenyellow'
},
lineStyle: { // 飞线颜色
width: 2,
color: '#02fd00',
opacity: 0.8
},
data: [[[121.5,28.5],[-56.5,4.2]]]
}
}
```
### Other comments [其他信息]

This is an automated message from the Apache Git Service.
To respond to the message, please log on GitHub and use the
URL above to go to the specific comment.
For queries about this service, please contact Infrastructure at:
us...@infra.apache.org
With regards,
Apache Git Services
-
To unsubscribe, e-mail: dev-unsubscr...@echarts.apache.org
For additional commands, e-mail: dev-h...@echarts.apache.org
[GitHub] LJJCherry commented on issue #8291: 如何实现实现地图作为背景,高亮中国地图
LJJCherry commented on issue #8291: 如何实现实现地图作为背景,高亮中国地图
URL:
https://github.com/apache/incubator-echarts/issues/8291#issuecomment-387300626


   弱弱的问一句,如何叠加呢。。。


This is an automated message from the Apache Git Service.
To respond to the message, please log on GitHub and use the
URL above to go to the specific comment.

For queries about this service, please contact Infrastructure at:
us...@infra.apache.org


With regards,
Apache Git Services

-
To unsubscribe, e-mail: dev-unsubscr...@echarts.apache.org
For additional commands, e-mail: dev-h...@echarts.apache.org
[GitHub] surui0419 commented on issue #8261: 3d地球上的3d飞线尾迹特效在长时间运行后会静止不动,但2d飞线上的尾迹特效却一直在运动
surui0419 commented on issue #8261: 3d地球上的3d飞线尾迹特效在长时间运行后会静止不动,但2d飞线上的尾迹特效却一直在运动
URL:
https://github.com/apache/incubator-echarts/issues/8261#issuecomment-386177478


   点击世界地图时,将世界地图上的飞线和特效点数据清空,并且地球停止转动,弹出中国地图。

点击中国地图的容器,让中国地图的消失,并且注销中国地图的echarts实例,再给世界地图的飞线和特效点添加数据,让地球恢复转动。反复进行这种操作会导致地球上的3d飞线尾迹特效静止吗?

   //点击地球时地球停止转动,中国地图打开
   this.globalEchart.getZr().on('click', ()=>{
   // 地球停止转动并且光照变暗
   this.globalEchart.setOption({
   globe:{
   viewControl: {// 用于鼠标的旋转缩放控制
   zoomSensitivity: 0, // 缩放灵敏度 0关闭缩放
   rotateSensitivity: [2,0], //控制横、纵旋转灵敏度
   autoRotate: false, // 控制地球是否自转
   autoRotateSpeed:0
   }
   }
   })
   this.openChinaMap()
   })

   //打开中国地图时绘制中国地图,并将世界地图上的飞线、点数据清空
   openChinaMap () { // 中国地图显示
   this.globalEchart.getZr().off('click')
   //绘制中国地图方法
   this.drawChinaMap()
   // 世界地图边界线变暗
   this.worldEchart.setOption({
   geo:{
   regions: [],
   itemStyle: {borderColor: "rgba(180, 183, 179, 0.01)"}
   }
   })
   // 世界地图的飞线消失
   this.globalEchart.setOption({series: {data: []}})
   // 世界地图上的特效点消失
   this.worldEchart.setOption({series: [
   { data: []},
   { data: []}
   ]})
   },

   //点击某容器关闭、销毁中国地图并且让地球边界线恢复亮度、飞仙特效点也都重新加入数据,地球转动
   closeChinaMap () { // 中国地图隐藏
   var that = this
   this.isHideChina = true
   this.isShowChina = false
   // 世界地图边界线恢复
   this.worldEchart.setOption({
   geo:{
   regions: [
   {
   name: 'South Africa\n南非',
   label:{
   show:true,
   fontSize:22,
   color: '#02fd00'
   },
   itemStyle:{
   areaColor: 'rgba(0,0,0,0.3)'
   }
   },
   {
   name: '上海',
   label:{
   show:true,
   fontSize:16,
   color: '#02fd00'
   },
   itemStyle:{
   areaColor: 'rgba(0,0,0,0.3)'
   }
   },
   {
   name: 'Lao PDR\n老挝',
   label:{
   show:true,
   fontSize:22,
   color: '#02fd00'
   },
   itemStyle:{
   areaColor: 'rgba(0,0,0,0.3)'
   }
   },
   {
   name: 'United State\n美国',
   label:{
   show:true,
   fontSize:22,
   color: '#b7c0c9'
   }
   }
   ],
   itemStyle: {borderColor: "rgba(255, 253, 250, 0.8)"}
   }
   })
   if(that.chinaEchart && !that.chinaEchart.isDisposed()) {
   that.chinaEchart.clear()
   that.chinaEchart.dispose()
   echarts.registerMap("china", {})
   // 世界地图的飞线显示
   that.globalEchart.setOption({ series: {data: that.worldLine}})
   // 世界地图上的特效点显示
   that.worldEchart.setOption({series: [
   {data: that.geoCoordMap.slice(0, 21).map((val)=>{
   return {
   name: val.name,
   value:val.value.concat([val.circleValue])
   }
   })},
   {data: that.singleLine}
   ]})
   // setTimeout(()=>{
   that.globalEchart.setOption({
   globe:{
   viewControl: {// 用于鼠标的旋转缩放控制
   zoomSensitivity: 0, // 缩放灵敏度 0关闭缩放
   rotateSensitivity: [2,0], //控制横、纵旋转灵敏度
   autoRotate: true, // 控制地球是否自转
   autoRotateDirection: "ccw", //控制自转方向
   targetCoord: [105.9526, 22.3017],
   autoRotateSpeed:10
   }
   }
   })
   // },2000)
   }
   setTimeout(()=>{
   this.globalEchart.getZr().on('click', ()=>{
   // 地球停止转动并且光照变暗
   this.globalEchart.setOption({
   globe:{
   viewControl: {// 用于鼠标的旋转缩放控制
   zoomSensitivity: 0, // 缩放灵敏度 0关闭缩放
   rotateSensitivity: [2,0], //控制横、纵旋转灵敏度
   autoRotate: false, // 控制地球是否自转
   autoRotateSpeed:0
   }
   }
   })
   this.openChinaMap()
   })
   },4000)
   },


This is an automated message from the Apache Git Service.
To respond to the message, please log on GitHub and use the
URL above to go to the specific comment.

For queries about this service, please contact Infrastructure at:
us...@infra.apache.org


With regards,
Apache Git Services

-
To unsubscribe, e-mail: dev-unsubscr...@echarts.apache.org
For additional commands, e-mail: dev-h...@echarts.apache.org
[GitHub] mahyrpt opened a new issue #8306: Wrong series representation when the data is updated using "setOption()"
mahyrpt opened a new issue #8306: Wrong series representation when the data is updated using "setOption()" URL: https://github.com/apache/incubator-echarts/issues/8306 ### One-line summary [问题简述] Wrong series representation when the data is updated using "setOption()" **Before the data update:**  **After the data update:**  ### Version & Environment [版本及环境] + ECharts version [ECharts 版本]: 4.1.0 + Browser version [浏览器类型和版本]: Google Chrome V.65.0.3325.181 (Official Build) (64-bit) + OS Version [操作系统类型和版本]: Windows 10 ### Expected behaviour [期望结果] The expected representation for the new data:  ### ECharts option [ECharts配置项] https://jsfiddle.net/5up2z9xz/7/ ### Other comments [其他信息] This is an automated message from the Apache Git Service. To respond to the message, please log on GitHub and use the URL above to go to the specific comment. For queries about this service, please contact Infrastructure at: us...@infra.apache.org With regards, Apache Git Services - To unsubscribe, e-mail: dev-unsubscr...@echarts.apache.org For additional commands, e-mail: dev-h...@echarts.apache.org
[GitHub] renrenguiwei opened a new issue #8308: echart地图每个省显示时,可以做到一个个逐个显示动画吗?
renrenguiwei opened a new issue #8308: echart地图每个省显示时,可以做到一个个逐个显示动画吗?
URL: https://github.com/apache/incubator-echarts/issues/8308


   现在需要中国地图在显示时,是一个一个省的显示,甲方的需求;echart官方显示是全部加载出来,不太好看!


This is an automated message from the Apache Git Service.
To respond to the message, please log on GitHub and use the
URL above to go to the specific comment.

For queries about this service, please contact Infrastructure at:
us...@infra.apache.org


With regards,
Apache Git Services

-
To unsubscribe, e-mail: dev-unsubscr...@echarts.apache.org
For additional commands, e-mail: dev-h...@echarts.apache.org
[GitHub] giorgiopagnoni commented on issue #8288: Google charts: timelines [question]
giorgiopagnoni commented on issue #8288: Google charts: timelines [question]
URL:
https://github.com/apache/incubator-echarts/issues/8288#issuecomment-387319424


   Thank you, I don't know how I missed that. But I think there's something
wrong with the legend in that example, am I right?


This is an automated message from the Apache Git Service.
To respond to the message, please log on GitHub and use the
URL above to go to the specific comment.

For queries about this service, please contact Infrastructure at:
us...@infra.apache.org


With regards,
Apache Git Services

-
To unsubscribe, e-mail: dev-unsubscr...@echarts.apache.org
For additional commands, e-mail: dev-h...@echarts.apache.org
[GitHub] eskimoblood opened a new issue #8307: How to react on clicks inside of marked Areas
eskimoblood opened a new issue #8307: How to react on clicks inside of marked
Areas
URL: https://github.com/apache/incubator-echarts/issues/8307


   ### One-line summary [问题简述]
   I want to add some interactions when the user clicks inside of a marked
Area, is there an event triggered that I can listen on?


This is an automated message from the Apache Git Service.
To respond to the message, please log on GitHub and use the
URL above to go to the specific comment.

For queries about this service, please contact Infrastructure at:
us...@infra.apache.org


With regards,
Apache Git Services

-
To unsubscribe, e-mail: dev-unsubscr...@echarts.apache.org
For additional commands, e-mail: dev-h...@echarts.apache.org
[GitHub] hanfengcan commented on issue #8268: 咨询关于dataset的数据转换方案
hanfengcan commented on issue #8268: 咨询关于dataset的数据转换方案
URL:
https://github.com/apache/incubator-echarts/issues/8268#issuecomment-387721698


   是不是可以转换成

   '''
   [month, xx部,xx部]
   [1月,32,43,]
   '''

   然后指定维度


This is an automated message from the Apache Git Service.
To respond to the message, please log on GitHub and use the
URL above to go to the specific comment.

For queries about this service, please contact Infrastructure at:
us...@infra.apache.org


With regards,
Apache Git Services

-
To unsubscribe, e-mail: dev-unsubscr...@echarts.apache.org
For additional commands, e-mail: dev-h...@echarts.apache.org
[GitHub] eskimoblood opened a new issue #8314: How to set the size of the symbol of an point under tooltip in line chart
eskimoblood opened a new issue #8314: How to set the size of the symbol of an
point under tooltip in line chart
URL: https://github.com/apache/incubator-echarts/issues/8314


   ### One-line summary [问题简述]

   I have a line chart and want to reduce the size of the circle when the
tooltip is shown for a point on the line.


This is an automated message from the Apache Git Service.
To respond to the message, please log on GitHub and use the
URL above to go to the specific comment.

For queries about this service, please contact Infrastructure at:
us...@infra.apache.org


With regards,
Apache Git Services

-
To unsubscribe, e-mail: dev-unsubscr...@echarts.apache.org
For additional commands, e-mail: dev-h...@echarts.apache.org
[GitHub] hanfengcan commented on issue #8268: 咨询关于dataset的数据转换方案
hanfengcan commented on issue #8268: 咨询关于dataset的数据转换方案
URL:
https://github.com/apache/incubator-echarts/issues/8268#issuecomment-387721698


   是不是可以转换成
   '''[month, xx部,xx部]
   [1月,32,43,]'''

   然后指定维度


This is an automated message from the Apache Git Service.
To respond to the message, please log on GitHub and use the
URL above to go to the specific comment.

For queries about this service, please contact Infrastructure at:
us...@infra.apache.org


With regards,
Apache Git Services

-
To unsubscribe, e-mail: dev-unsubscr...@echarts.apache.org
For additional commands, e-mail: dev-h...@echarts.apache.org
[GitHub] StimulateX opened a new issue #8315: 关于Uncaught TypeError: i.getOtherAxis is not a function的问题
StimulateX opened a new issue #8315: 关于Uncaught TypeError: i.getOtherAxis is
not a function的问题
URL: https://github.com/apache/incubator-echarts/issues/8315


   ### One-line summary [问题简述]

   在利用map.markline时出现 TypeError: i.getOtherAxis is not a function的问题


   ### Version & Environment [版本及环境]
   + ECharts version [ECharts 版本]:3.0
   + Browser version [浏览器类型和版本]chrome:
   + OS Version [操作系统类型和版本]:win7


   ### Expected behaviour [期望结果]


   能产生正确的markline


   ### ECharts option [ECharts配置项]


   ```javascript
   option = {
   title: {
   text: '出行线图',
   left: 'center',
   textStyle: {
   color: 'black'
   }
   },
  // backgroundColor: '#003',

   bmap: {
   center: [106.7 , 26.59],
   zoom: 11,
   roam: true,
   zlevel: 1,
   mapStyle: {
   'styleJson': [
 {
   "featureType": "background",
   "elementType": "all",
   "stylers": {
 "color": "#",
 "lightness": 10
   }
 },
 {
   "featureType": "highway",
   "elementType": "all",
   "stylers": {
 "visibility": "off"
   }
 },
 {
   "featureType": "railway",
   "elementType": "all",
   "stylers": {
 "visibility": "off"
   }
 }
   ]
   },

 },


   legend: {
   left: '67%',
   top:'70%',
   orient:'vertical',
   data: ['bp'],
   textStyle: {
   color: 'black'
   }

   },

   series: [

   {
   type: 'lines',
name:'bp',
   coordinateSystem: 'bmap',
   polyline: true,
   data: zone_boundary,
   silent: true,
   lineStyle: {
   normal: {
  // color: '#FFF4DC',
   color: 'black',
   opacity: 0.5,
   width: 1
   }
   },
   blendMode: 'lighter',
   progressiveThreshold: 500,
   progressive: 200

   },
{
   name: '全部',
   type:'map',
   mapType: 'bmap',
coordinateSystem:'bmap',
   data:[],

   markLine: {
 Symbol:['none', 'arrow'],
 symbolSize:['0', '0.1'],
 smooth:true,
 smooth:10,
 effect : {
   show: true,
   scaleSize: 1,
   period: 30,
   color: '#fff',
   shadowBlur: 10
 },
 itemStyle : {
   color: 'red',
   normal: {
 color:function(param){
   return(param.data[0].value.colorValue);
 },
 borderWidth:1,
 lineStyle: {
   type: 'dashed',
   width: 1.5,
   shadowBlur: 10
 },
 label:{show:false}
   }
 },

  data: [
   [{name:'p401'}, {name:'p900',value:{colorValue:'grey'}}],
   [{name:'p402'}, {name:'p900',value:{colorValue:'grey'}}],
   [{name:'p403'}, {name:'p900',value:{colorValue:'grey'}}],
   [{name:'p404'}, {name:'p900',value:{colorValue:'grey'}}],
   [{name:'p405'}, {name:'p900',value:{colorValue:'grey'}}],
   [{name:'p406'}, {name:'p900',value:{colorValue:'grey'}}],
   [{name:'p407'}, {name:'p900',value:{colorValue:'grey'}}],
   [{name:'p408'}, {name:'p900',value:{colorValue:'grey'}}],
   [{name:'p409'}, {name:'p900',value:{colorValue:'grey'}}]

 ],

   geoCoord:{
 'p900': [106.640203688,26.61260648],
 'p401':[106.662699566,26.609016217],
 'p402':[106.639447412,26.5927907224],
 'p403':[106.620613145,26.6130472914],
 'p404':[106.65572277,26.6229719604],
 'p405':[106.623665642,26.6340606309],
 'p406':[106.641943257,26.6395769923],