Hi
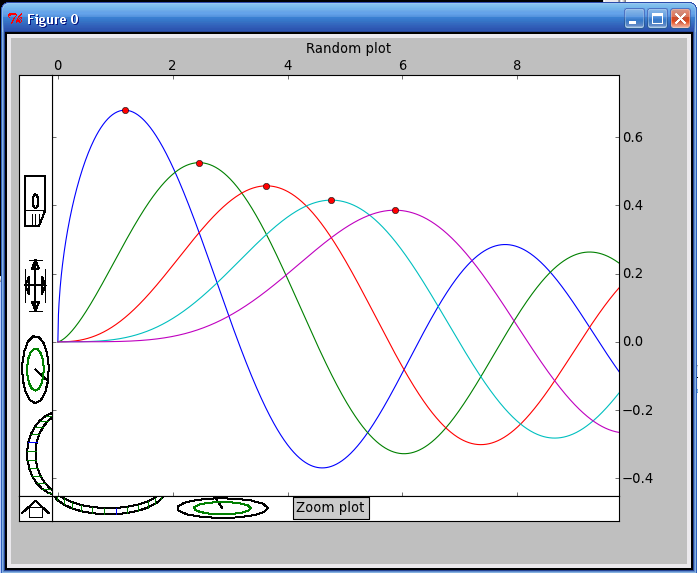
I've made a lib to replace the default Matplotlib toolbar, it looks like
this:
http://i256.photobucket.com/albums/hh163/_pelya/mpl-gui.png
It replaces the pan/zoom button with wheels and handles, using new
subplot2grid API of matplotlib 1.0.1.
The reason behind that change is that people I'm currently writing my
application for can hardly handle
anything that doesn't look like their 50-years-old potentiostat. Also, I
needed some custom event code to
interact with the figure (typically to mark a part of the graph), and
enabling/disabling pan/zoom mode
each time I need to make a change to the figure is not convenient.

Here's the sources:
http://elchemgraphview.svn.sourceforge.net/viewvc/elchemgraphview/

Currently it supports only subplot() API, similar to the Matplotlib API with
the same name,
also it requires quite a lot of a boilerplate code - see simpletest.py or
test.py for example.
As a bonus you can add your own buttons to that new toolbar, however my
designer skills
are rather poor, so it looks like MS Paint drawing.
If anyone is interested I can extend it to the point where you need only to
write
"import vintage" to get the new controls - it will replace several
matplotlib functions like pyplot.figure(),
pyplot.subplot() and pyplot.connect() with it's own handlers, right inside
pyplot module namespace.
------------------------------------------------------------------------------
All of the data generated in your IT infrastructure is seriously valuable.
Why? It contains a definitive record of application performance, security
threats, fraudulent activity, and more. Splunk takes this data and makes
sense of it. IT sense. And common sense.
http://p.sf.net/sfu/splunk-d2d-c2
_______________________________________________
Matplotlib-users mailing list
Matplotlib-users@lists.sourceforge.net
https://lists.sourceforge.net/lists/listinfo/matplotlib-users