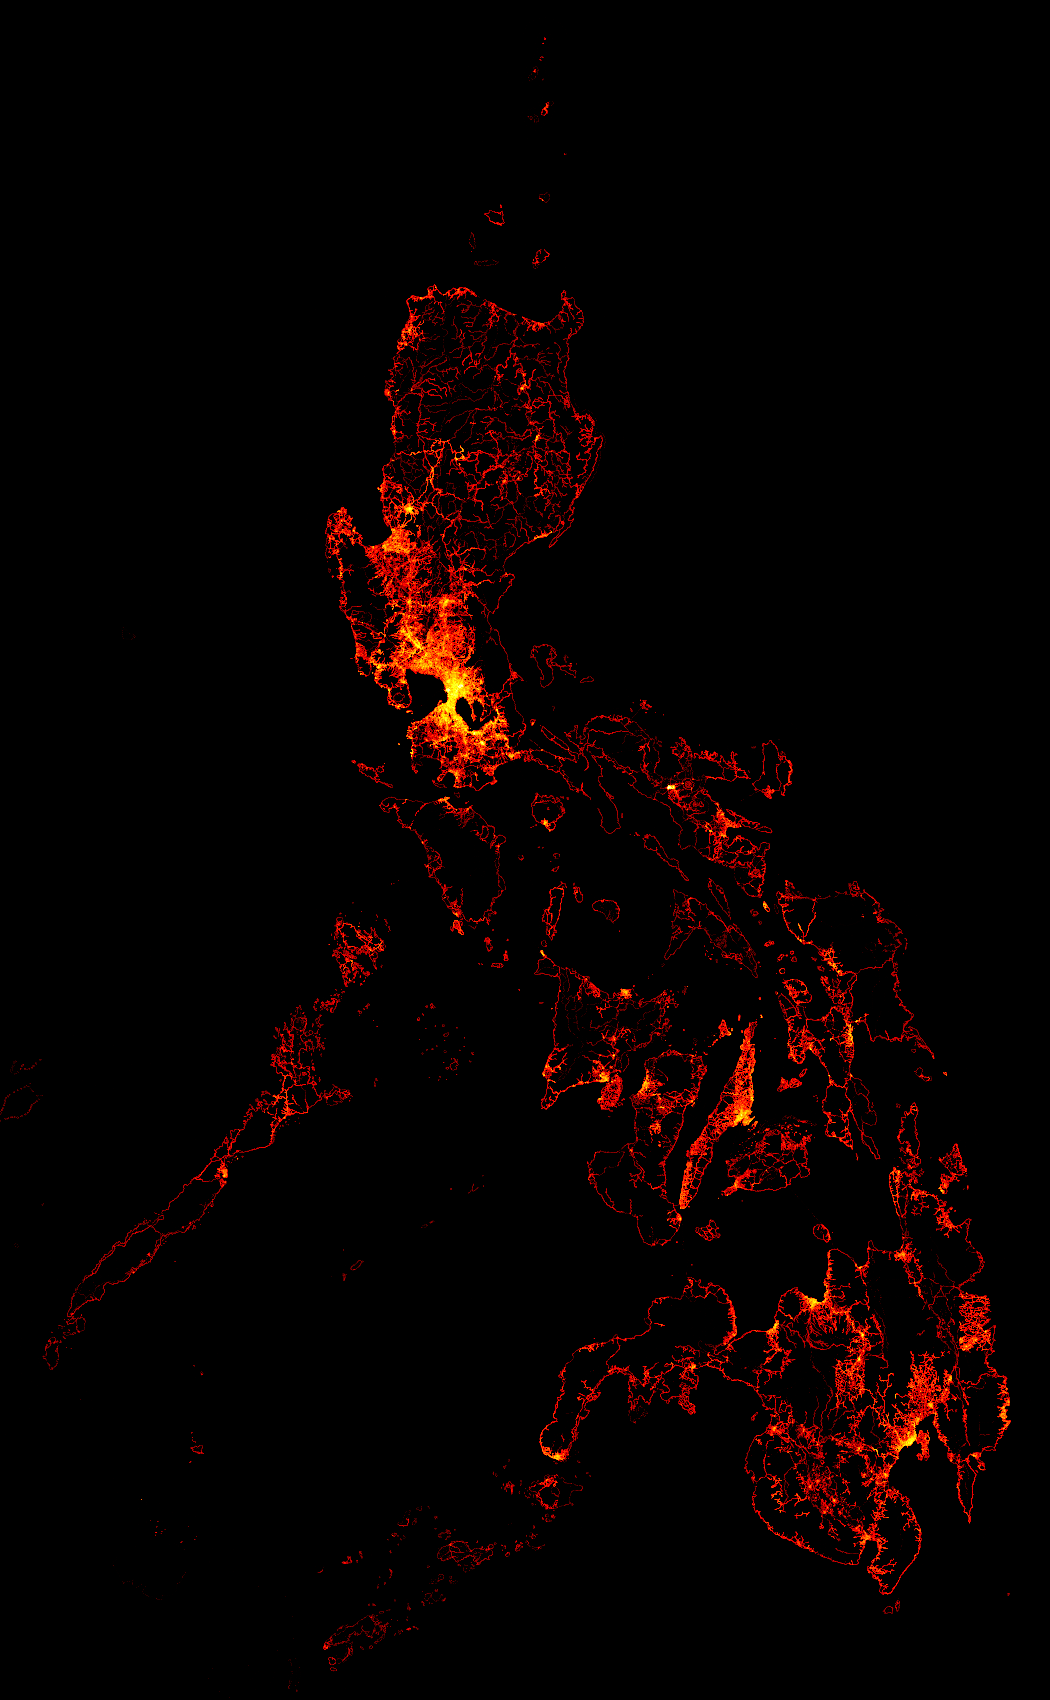
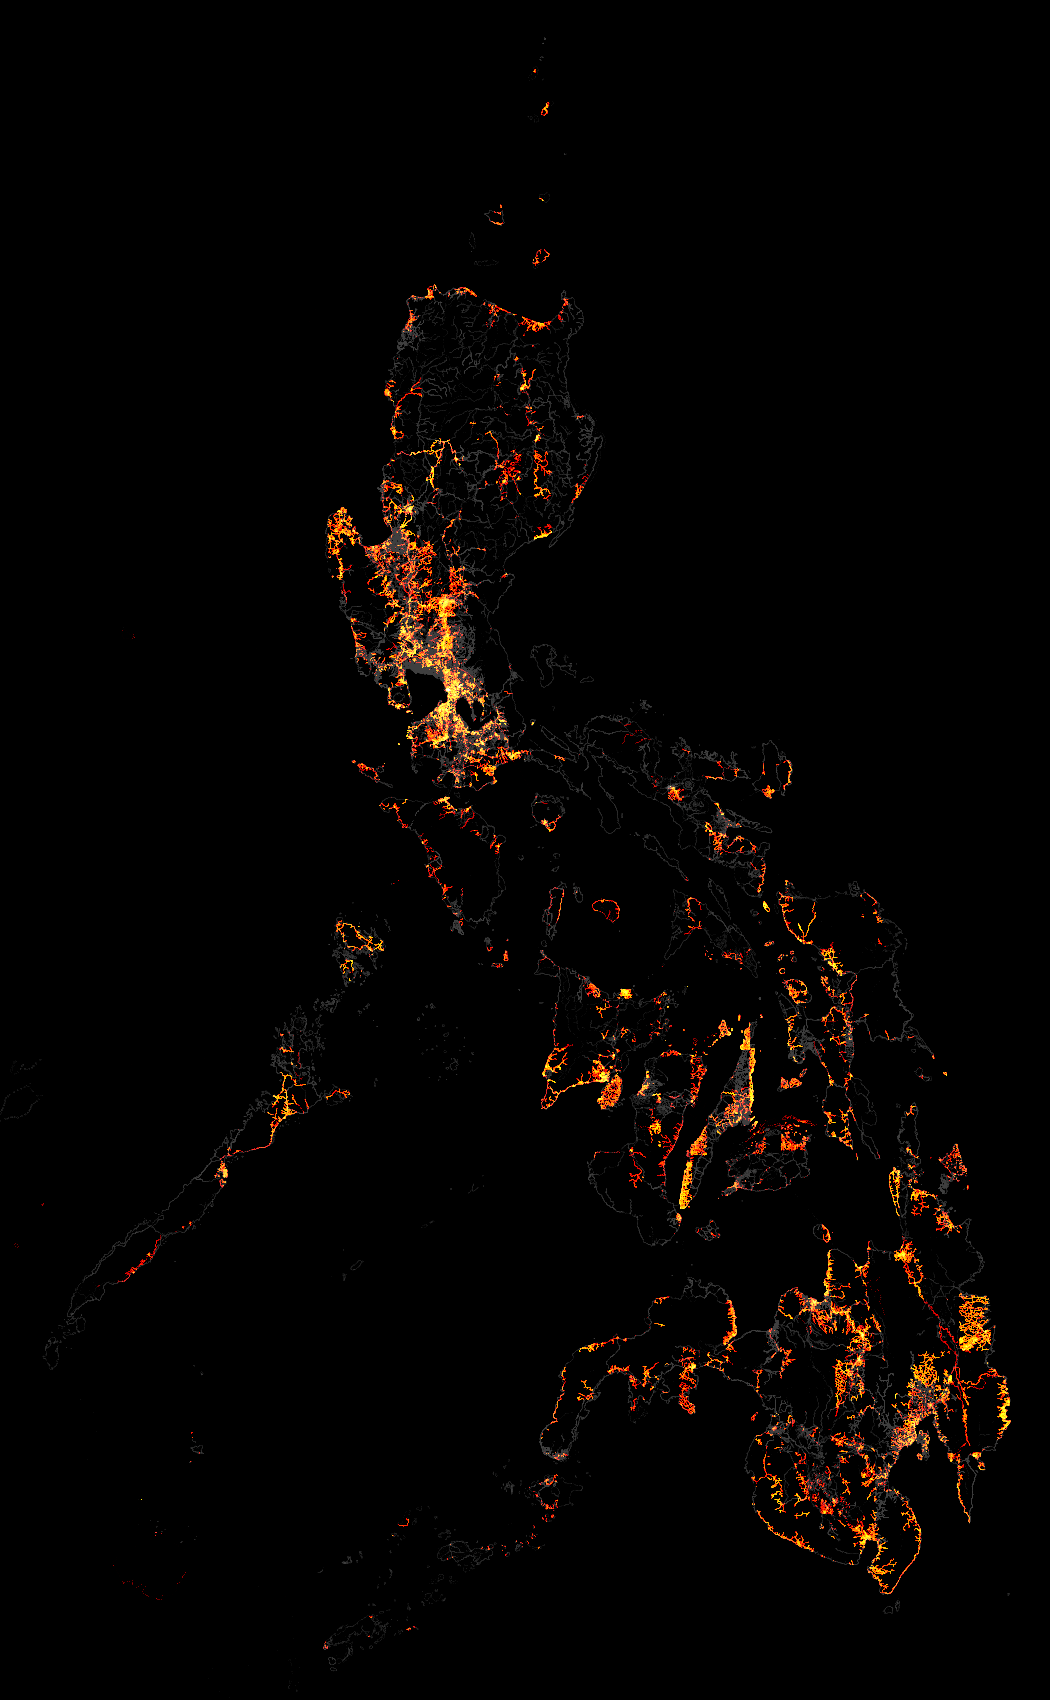
Hi guys,

Here's the 2013 1st quarter update to the node density visualizations.
Absolute node density as of April 1, 2013:
http://wiki.openstreetmap.org/wiki/File:Philippines_node_density_2013-04-01.png

Node density increase from January 1, 2013 to April 1, 2013:
http://wiki.openstreetmap.org/wiki/File:Philippines_node_density_increase_from_2013-01-01_to_2013-04-01.png

Some of the places that have noticeable improvements include:
- Cagayan Valley
- northern Cebu (thanks to Totor)
- Mindanao's Rio Grande rivers/tributaries (thanks to maning)
- Camiguin (thanks to Schadow1)
- eastern Mindanao, specifically the areas hit by Typhoon Pablo (thanks to
HOT)


Keep on mapping!


On Wed, Jan 9, 2013 at 4:44 AM, Eugene Alvin Villar <[email protected]>wrote:

> Hi guys,
>
> Here's a new year update to the node density visualizations.
>
> Here is the absolute node density as of January 1, 2013:
>
> http://wiki.openstreetmap.org/w/images/f/f2/Philippines_node_density_2013-01-01.png
>
> And here's the node density increase comparing January 2, 2012 and January
> 1, 2013:
>
> http://wiki.openstreetmap.org/w/images/5/5b/Philippines_node_density_increase_from_2012-01-02_to_2013-01-01.png
>
> The increase in the number of nodes last year is pretty much distributed
> throughout the archipelago. The most number of increase is in the Quiapo
> area and this is due to maning's project there.
>
> Good work everyone! Let's make 2013 even better. :)
>
_______________________________________________
talk-ph mailing list
[email protected]
http://lists.openstreetmap.org/listinfo/talk-ph