Toralf Förster:
> I do wonder about any changes in the algorithm which drops the cw of a
> relay [1] by a magnitude within 1 year as seen in [2]?
>
> [1]
> https://metrics.torproject.org/rs.html#details/1AF72E8906E6C49481A791A6F8F84F8DFEBBB2BA
> [2]
> https://screenshotscdn.firefoxusercontent.com/images/040958f1-a5be-4630-9551-c8f6f9952a5e.png
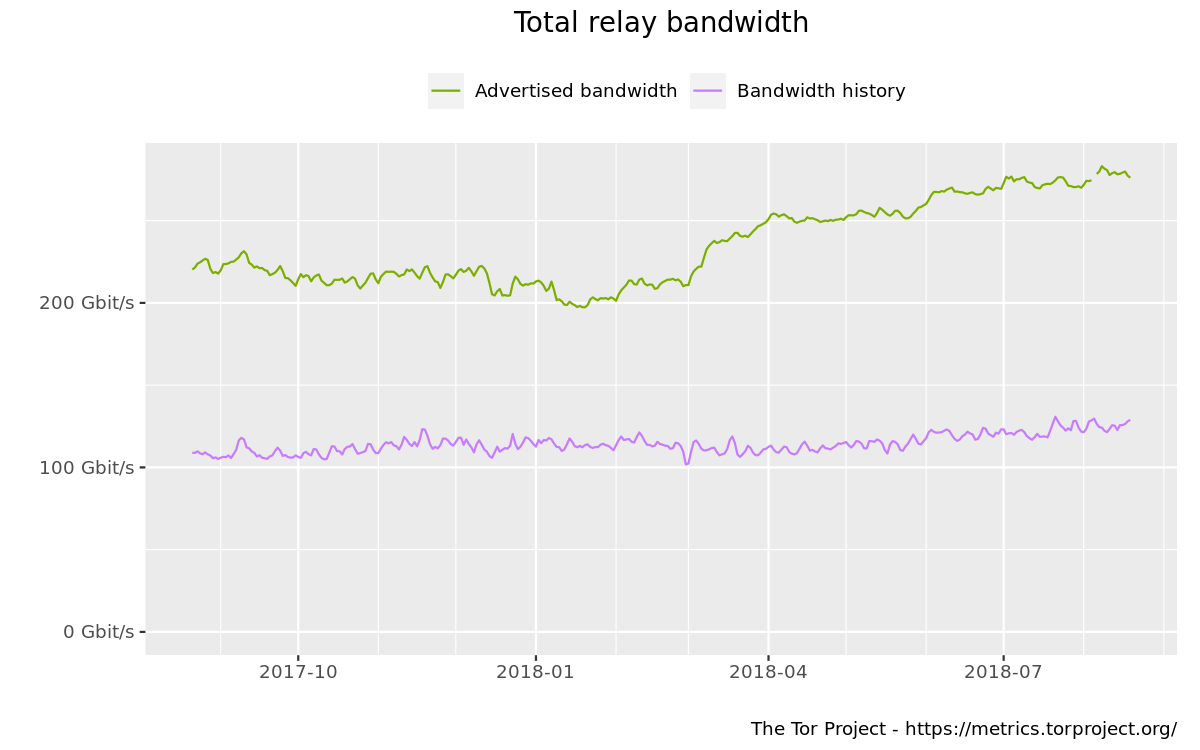
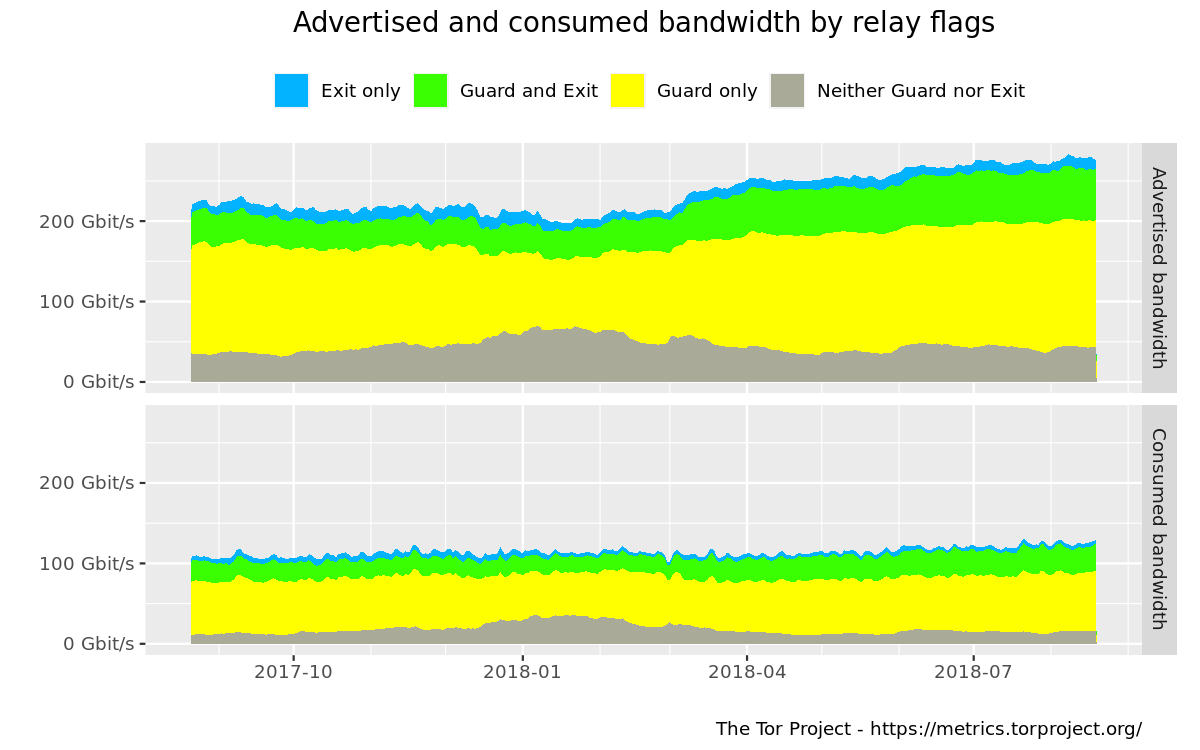
You are looking at cw **fraction**, which is a relative value compared to the
rest of the network,
which is why I think it isn't the best value to look at when trying to
determine "is my relay
doing better or worse than usual?"

If your relay is doing great as usual and others add 50 Gbit/s of capacity you
might see
your cw fraction and exit probability go down.

Your cw fraction and exit probability is decreasing since several month, at the
same time the
the overall tor network capacity increased:

https://metrics.torproject.org/bandwidth.png?start=2017-08-21&end=2018-08-19
https://metrics.torproject.org/bandwidth-flags.png?start=2017-08-21&end=2018-08-19


The better question might be: Did your absolute cw value decrease as well or
did it remain static?


This is why I'd like to see absolute CW graphs in addition to the fraction
graphs (and even the ratio of them),
here is the ticket:

https://trac.torproject.org/projects/tor/ticket/26767

--
https://twitter.com/nusenu_
https://mastodon.social/@nusenu
![]() signature.asc
signature.asc
Description: OpenPGP digital signature
_______________________________________________
tor-relays mailing list
[email protected]
https://lists.torproject.org/cgi-bin/mailman/listinfo/tor-relays