** Attachment added: "Screenshot at 2012-03-08 15:29:39.png"

https://bugs.launchpad.net/bugs/949719/+attachment/2833045/+files/Screenshot%20at%202012-03-08%2015%3A29%3A39.png
** Changed in: lybniz (Ubuntu)
Status: New => Confirmed
** Description changed:
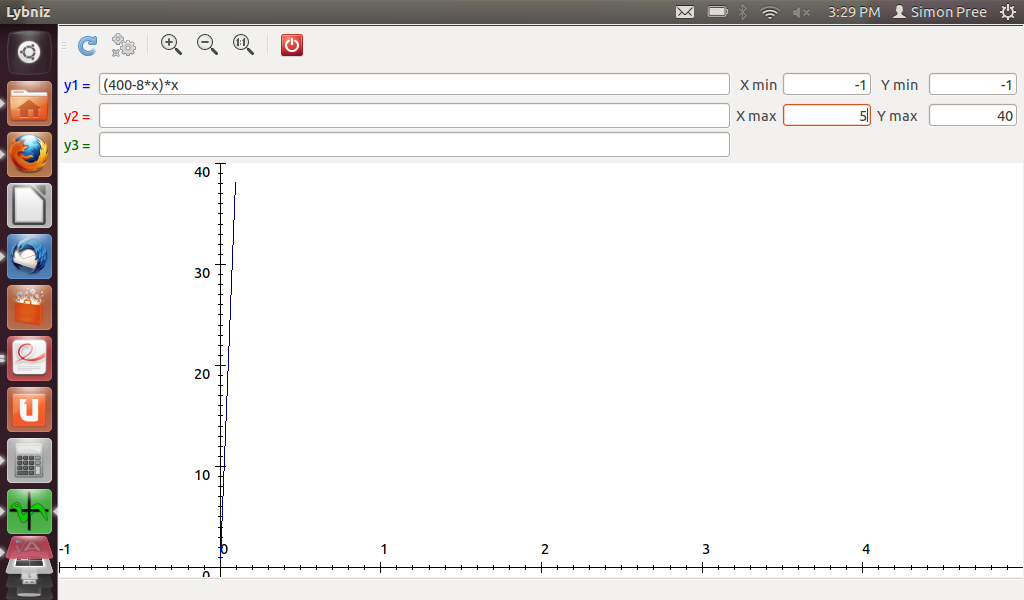
like the summary says. see the attached screenshot. at the coordinate
- x=38 the graph just stops.
+ x=38 the graph just stops. Using Ubuntu 11.10.
--
You received this bug notification because you are a member of Ubuntu
Bugs, which is subscribed to Ubuntu.
https://bugs.launchpad.net/bugs/949719
Title:
lybniz doesn't display graphs properly if they are outside the set
maximum coordinates
To manage notifications about this bug go to:
https://bugs.launchpad.net/ubuntu/+source/lybniz/+bug/949719/+subscriptions
--
ubuntu-bugs mailing list
[email protected]
https://lists.ubuntu.com/mailman/listinfo/ubuntu-bugs