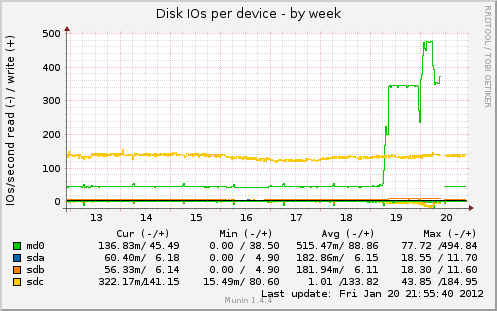
Just for reference, here is a graph of IO operations, showing the
additional load. The green line is /dev/md0 but that is a RAID mirror of
/dev/sda and /dev/sdb so they are taking the load. NOTE: the load on
/dev/sdc is constant and would typically be the drive taking the most
load. This graph seems very plausible to me.
** Attachment added: "Disk IOs per device - by week"

https://bugs.launchpad.net/ubuntu/+source/munin/+bug/919429/+attachment/2684671/+files/diskstats_iops-week.png

--
You received this bug notification because you are a member of Ubuntu
Server Team, which is subscribed to munin in Ubuntu.
https://bugs.launchpad.net/bugs/919429

Title:
  Munin "IO Service Time" graph gives completely implausible numbers

To manage notifications about this bug go to:
https://bugs.launchpad.net/ubuntu/+source/munin/+bug/919429/+subscriptions

--
Ubuntu-server-bugs mailing list
Ubuntu-server-bugs@lists.ubuntu.com
Modify settings or unsubscribe at:
https://lists.ubuntu.com/mailman/listinfo/ubuntu-server-bugs