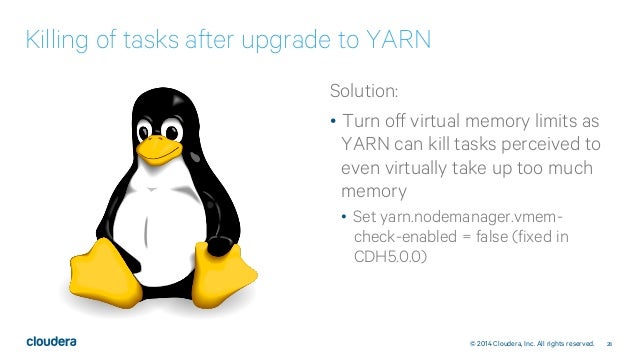
Hi Manoj & Naga,
I’m surprised but there is no such a property in CHD conf files (greped all
*.xml in OSes where yarn lives!)
I think that this property is set by Cloudera:
http://image.slidesharecdn.com/yarnsaboutyarn-kathleenting112114-141125155911-conversion-gate01/95/yarns-about-yarn-28-638.jpg?cb=1416931543

<http://image.slidesharecdn.com/yarnsaboutyarn-kathleenting112114-141125155911-conversion-gate01/95/yarns-about-yarn-28-638.jpg?cb=1416931543>
(we use chd 5.4.5)
> 25 сент. 2015 г., в 10:19, Naganarasimha Garla <[email protected]>
> написал(а):
>
> Hi Manoj & Ilya,
>
> From the logs
> 2015-09-21 22:50:34,018 WARN
> org.apache.hadoop.yarn.server.nodemanager.containermanager.monitor.ContainersMonitorImpl:
>  Container [pid=13982,containerID=container_1442402147223_0165_01_000001] is
> running beyond physical memory limits.
>
> This indicates that its increase in Physical memory limits and not virtual
> limits due to which container was killed and also probability that Container
> Monitor  would  wait till vmem is 3.4 GB when limit is 2.1 GB to kill it is
> less.
>
> Vmem includes overall memory limits including the files opened etc ... but
> seems like virtual mem check in your setup seems to be disabled. please check
> for configuration as mentioned by Manoj "yarn.nodemanager.vmem-check-enabled
> "  to cross verify <>
>
>
> On Fri, Sep 25, 2015 at 12:15 PM, Ilya Karpov <[email protected]
> <mailto:[email protected]>> wrote:
> Hello, Manoj
> the actual question is why this happens
>
>> 24 сент. 2015 г., в 20:39, manoj <[email protected]
>> <mailto:[email protected]>> написал(а):
>>
>> Hello IIya,
>>
>> Looks like the Vmem usage is going above the above 2.1 of Pmem times thats
>> why the container is getting killed,
>>
>> 1.0 GB of 1 GB physical memory used; 3.4 GB of 2.1 GB virtual memory used
>>
>> By default Vmem is set to 2.1 times of the Pmem.
>> Looks like your job is taking 3.4GB!
>>
>> You can change the ratio by setting in Yarn-site.xml:
>> yarn.nodemanager.vmem-pmem-ratio  <>
>>
>>  <>
>> You can optionally disable this check by setting following to false:
>>
>> yarn.nodemanager.vmem-check-enabled  <>
>>
>>  <>
>>
>>  <>
>> Thanks,
>> -Manoj
>>
>> On Wed, Sep 23, 2015 at 12:36 AM, Ilya Karpov <[email protected]
>> <mailto:[email protected]>> wrote:
>> Great thanks for your reply!
>>
>> >1. Which version of Hadoop/ YARN ?
>> Hadoop(command: hadoop version):
>> Hadoop 2.6.0-cdh5.4.5
>> Subversion http://github.com/cloudera/hadoop
>> <http://github.com/cloudera/hadoop> -r
>> ab14c89fe25e9fb3f9de4fb852c21365b7c5608b
>> Compiled by jenkins on 2015-08-12T21:11Z
>> Compiled with protoc 2.5.0
>> From source with checksum d31cb7e46b8602edaf68d335b785ab
>> This command was run using
>> /opt/cloudera/parcels/CDH-5.4.5-1.cdh5.4.5.p0.7/jars/hadoop-common-2.6.0-cdh5.4.5.jar
>> Yarn (command: yarn version) prints exactly the same.
>>
>> >2. From the logs is it getting killed due to over usage of Vmem or Physical
>> >memory ?
>> Because of over usage of Physical memory. Last seconds of life:
>> 2015-09-21 22:50:34,017 INFO
>> org.apache.hadoop.yarn.server.nodemanager.containermanager.monitor.ContainersMonitorImpl:
>>  Memory usage of ProcessTree 13982 for container-id
>> container_1442402147223_0165_01_000001: 1.0 GB of 1 GB physical memory used;
>> 3.4 GB of 2.1 GB virtual memory used
>> 2015-09-21 22:50:34,017 WARN
>> org.apache.hadoop.yarn.server.nodemanager.containermanager.monitor.ContainersMonitorImpl:
>>  Process tree for container: container_1442402147223_0165_01_000001 has
>> processes older than 1 iteration running over the configured limit.
>> Limit=1073741824, current usage = 1074352128
>> 2015-09-21 22:50:34,018 WARN
>> org.apache.hadoop.yarn.server.nodemanager.containermanager.monitor.ContainersMonitorImpl:
>>  Container [pid=13982,containerID=container_1442402147223_0165_01_000001] is
>> running beyond physical memory limits. Current usage: 1.0 GB of 1 GB
>> physical memory used; 3.4 GB of 2.1 GB virtual memory used. Killing
>> container.
>> Dump of the process-tree for container_1442402147223_0165_01_000001 :
>>         |- PID PPID PGRPID SESSID CMD_NAME USER_MODE_TIME(MILLIS)
>> SYSTEM_TIME(MILLIS) VMEM_USAGE(BYTES) RSSMEM_USAGE(PAGES) FULL_CMD_LINE
>>         |- 13994 13982 13982 13982 (java) 4285 714 3602911232 261607
>> /opt/jdk1.8.0_60/bin/java -Dlog4j.configuration=container-log4j.properties
>> -Dyarn.app.container.log.dir=/var/log/hadoop-yarn/contai
>> ner/application_1442402147223_0165/container_1442402147223_0165_01_000001
>> -Dyarn.app.container.log.filesize=0 -Dhadoop.root.logger=INFO,CLA
>> -Djava.net.preferIPv4Stack=true -Xmx825955249 org.apache.had
>> oop.mapreduce.v2.app.MRAppMaster
>>         |- 13982 13980 13982 13982 (bash) 0 0 14020608 686 /bin/bash -c
>> /opt/jdk1.8.0_60/bin/java -Dlog4j.configuration=container-log4j.properties
>> -Dyarn.app.container.log.dir=/var/log/hadoop-yarn/container/application_1442402147223_0165/container_1442402147223_0165_01_000001
>>  -Dyarn.app.container.log.filesize=0 -Dhadoop.root.logger=INFO,CLA
>> -Djava.net.preferIPv4Stack=true -Xmx825955249
>> org.apache.hadoop.mapreduce.v2.app.MRAppMaster
>> 1>/var/log/hadoop-yarn/container/application_1442402147223_0165/container_1442402147223_0165_01_000001/stdout
>>
>> 2>/var/log/hadoop-yarn/container/application_1442402147223_0165/container_1442402147223_0165_01_000001/stderr
>>
>> 2015-09-21 22:50:34,018 INFO
>> org.apache.hadoop.yarn.server.nodemanager.containermanager.monitor.ContainersMonitorImpl:
>>  Removed ProcessTree with root 13982
>> 2015-09-21 22:50:34,025 INFO
>> org.apache.hadoop.yarn.server.nodemanager.containermanager.container.Container:
>>  Container container_1442402147223_0165_01_000001 transitioned from RUNNING
>> to KILLING
>> 2015-09-21 22:50:34,025 INFO
>> org.apache.hadoop.yarn.server.nodemanager.containermanager.launcher.ContainerLaunch:
>>  Cleaning up container container_1442402147223_0165_01_000001
>> 2015-09-21 22:50:34,075 WARN
>> org.apache.hadoop.yarn.server.nodemanager.DefaultContainerExecutor: Exit
>> code from container container_1442402147223_0165_01_000001 is : 143
>>
>> >3. Can you run " jmap -histo -F <PID of AM container>" and share the heap
>> >dump result?
>> I’ll try to do it asap.
>>
>> >4. If possible can you pastebin the AM logs?
>> yes,
>> https://drive.google.com/file/d/0B1DPTV7TbcO0cEEwSDZyUnBWUEk/view?usp=sharing
>>
>> <https://drive.google.com/file/d/0B1DPTV7TbcO0cEEwSDZyUnBWUEk/view?usp=sharing>
>>
>>
>>
>>
>> > 23 сент. 2015 г., в 7:21, Naganarasimha G R (Naga)
>> > <[email protected] <mailto:[email protected]>>
>> > написал(а):
>> >
>> > Hi Ilya,
>> >    In a normal case AM memory requirement should not be more than the
>> > default for small sized jobs, but seems to be something erroneous in your
>> > case, Would like to have more information :
>> > 1. Which version of Hadoop/ YARN ?
>> > 2. From the logs is it getting killed due to over usage of Vmem or
>> > Physical memory ?
>> > 3. Can you run " jmap -histo -F <PID of AM container>" and share the heap
>> > dump result?
>> > 4. If possible can you pastebin the AM logs?
>> >
>> > + Naga
>> > ________________________________________
>> > From: Ilya Karpov [[email protected] <mailto:[email protected]>]
>> > Sent: Tuesday, September 22, 2015 21:06
>> > To: [email protected] <mailto:[email protected]>
>> > Subject: Why would ApplicationManager request RAM more that defaut 1GB?
>> >
>> > Hi all,
>> > can’t figure out subj.
>> > On my hadoop cluster I have an issue when ApplicationMaster(AM) killed by
>> > NodeManager because AM tries to allocate more than default 1GB. MR
>> > application, that AM is in charge of, is a mapper only job(1(!) mapper, no
>> > reducers, downloads data from remote source). At the moment when AM
>> > killed, MR job is ok (uses about 70% of ram limit). MR job doesn't have
>> > any custom counters, distributes caches etc, just downloads data (by
>> > portions) via custom input format. To fix this issue, I raised memory
>> > limit for AM, but I want to know what is the reason of eating 1GB (!) for
>> > a trivial job like mine?
>> >
>>
>>
>>
>>
>> --
>> --Manoj Kumar M
>
>