Took your advice and created a test app that adds and removes DateField4
components, directly and onto a comparative ExplorerBar component for
experiments.
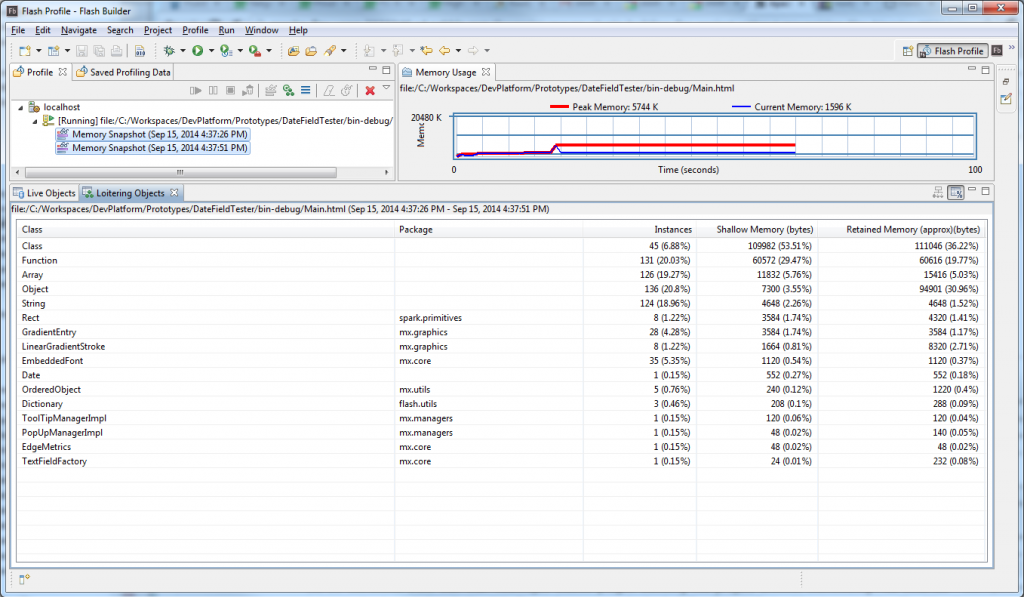
Now, last time I tried to show some code on here directly all the CDATA
stuff couldn't be seen. So I've uploaded it as a files this time (you'll
need the jabbypanda component if you wanted to check it out completely).

Main.mxml
<http://apache-flex-users.2333346.n4.nabble.com/file/n7995/Main.mxml>
ExplorerBar.mxml
<http://apache-flex-users.2333346.n4.nabble.com/file/n7995/ExplorerBar.mxml>

I'm not getting the same leaks but looking at the loitering objects I'm
getting stuff left over.

So running up that application in profiler, if after it loads I do the
following steps:
1. Press "Run garbage collector" a few times
2. Take a snapshot.
3. Press "Create Date" 5 times.
4. Press "Remove Dates"
5. Press "Allocate some memory" (just so the gc sweep can be kicked)
6. Press "Clear allocated memory"
7. Press "Run garbage collector" a few times
8. Take a snapshot
9. Press "Find loitering objects" on the 2 snapshots.

I then get the following loitering objects:
http://i629.photobucket.com/albums/uu19/drevans112/Allocate/Profiler-Add-DateField4-Controls.png

....Of which I would expect none. Is this expected behaviour? Should it be
totally clear? Are these genuine leaks?

I get a similar (if not the same set of leaks) if I swap the DateField4
component for the basic mx:DateField component.


Alex Harui wrote
> That is a weird one.  Nothing obvious I can see.  It might be time to
> create a simple test case.
>
> In could also be an interaction where the setting of the height isn't the
> problem, it is the setting of the height along with something else.  To
> test that, remove everything except the height=20 and see if it is still a
> problem.
>
> -Alex


--
View this message in context:
http://apache-flex-users.2333346.n4.nabble.com/Using-Adobe-Scout-to-locate-memory-leak-tp7770p7995.html
Sent from the Apache Flex Users mailing list archive at Nabble.com.