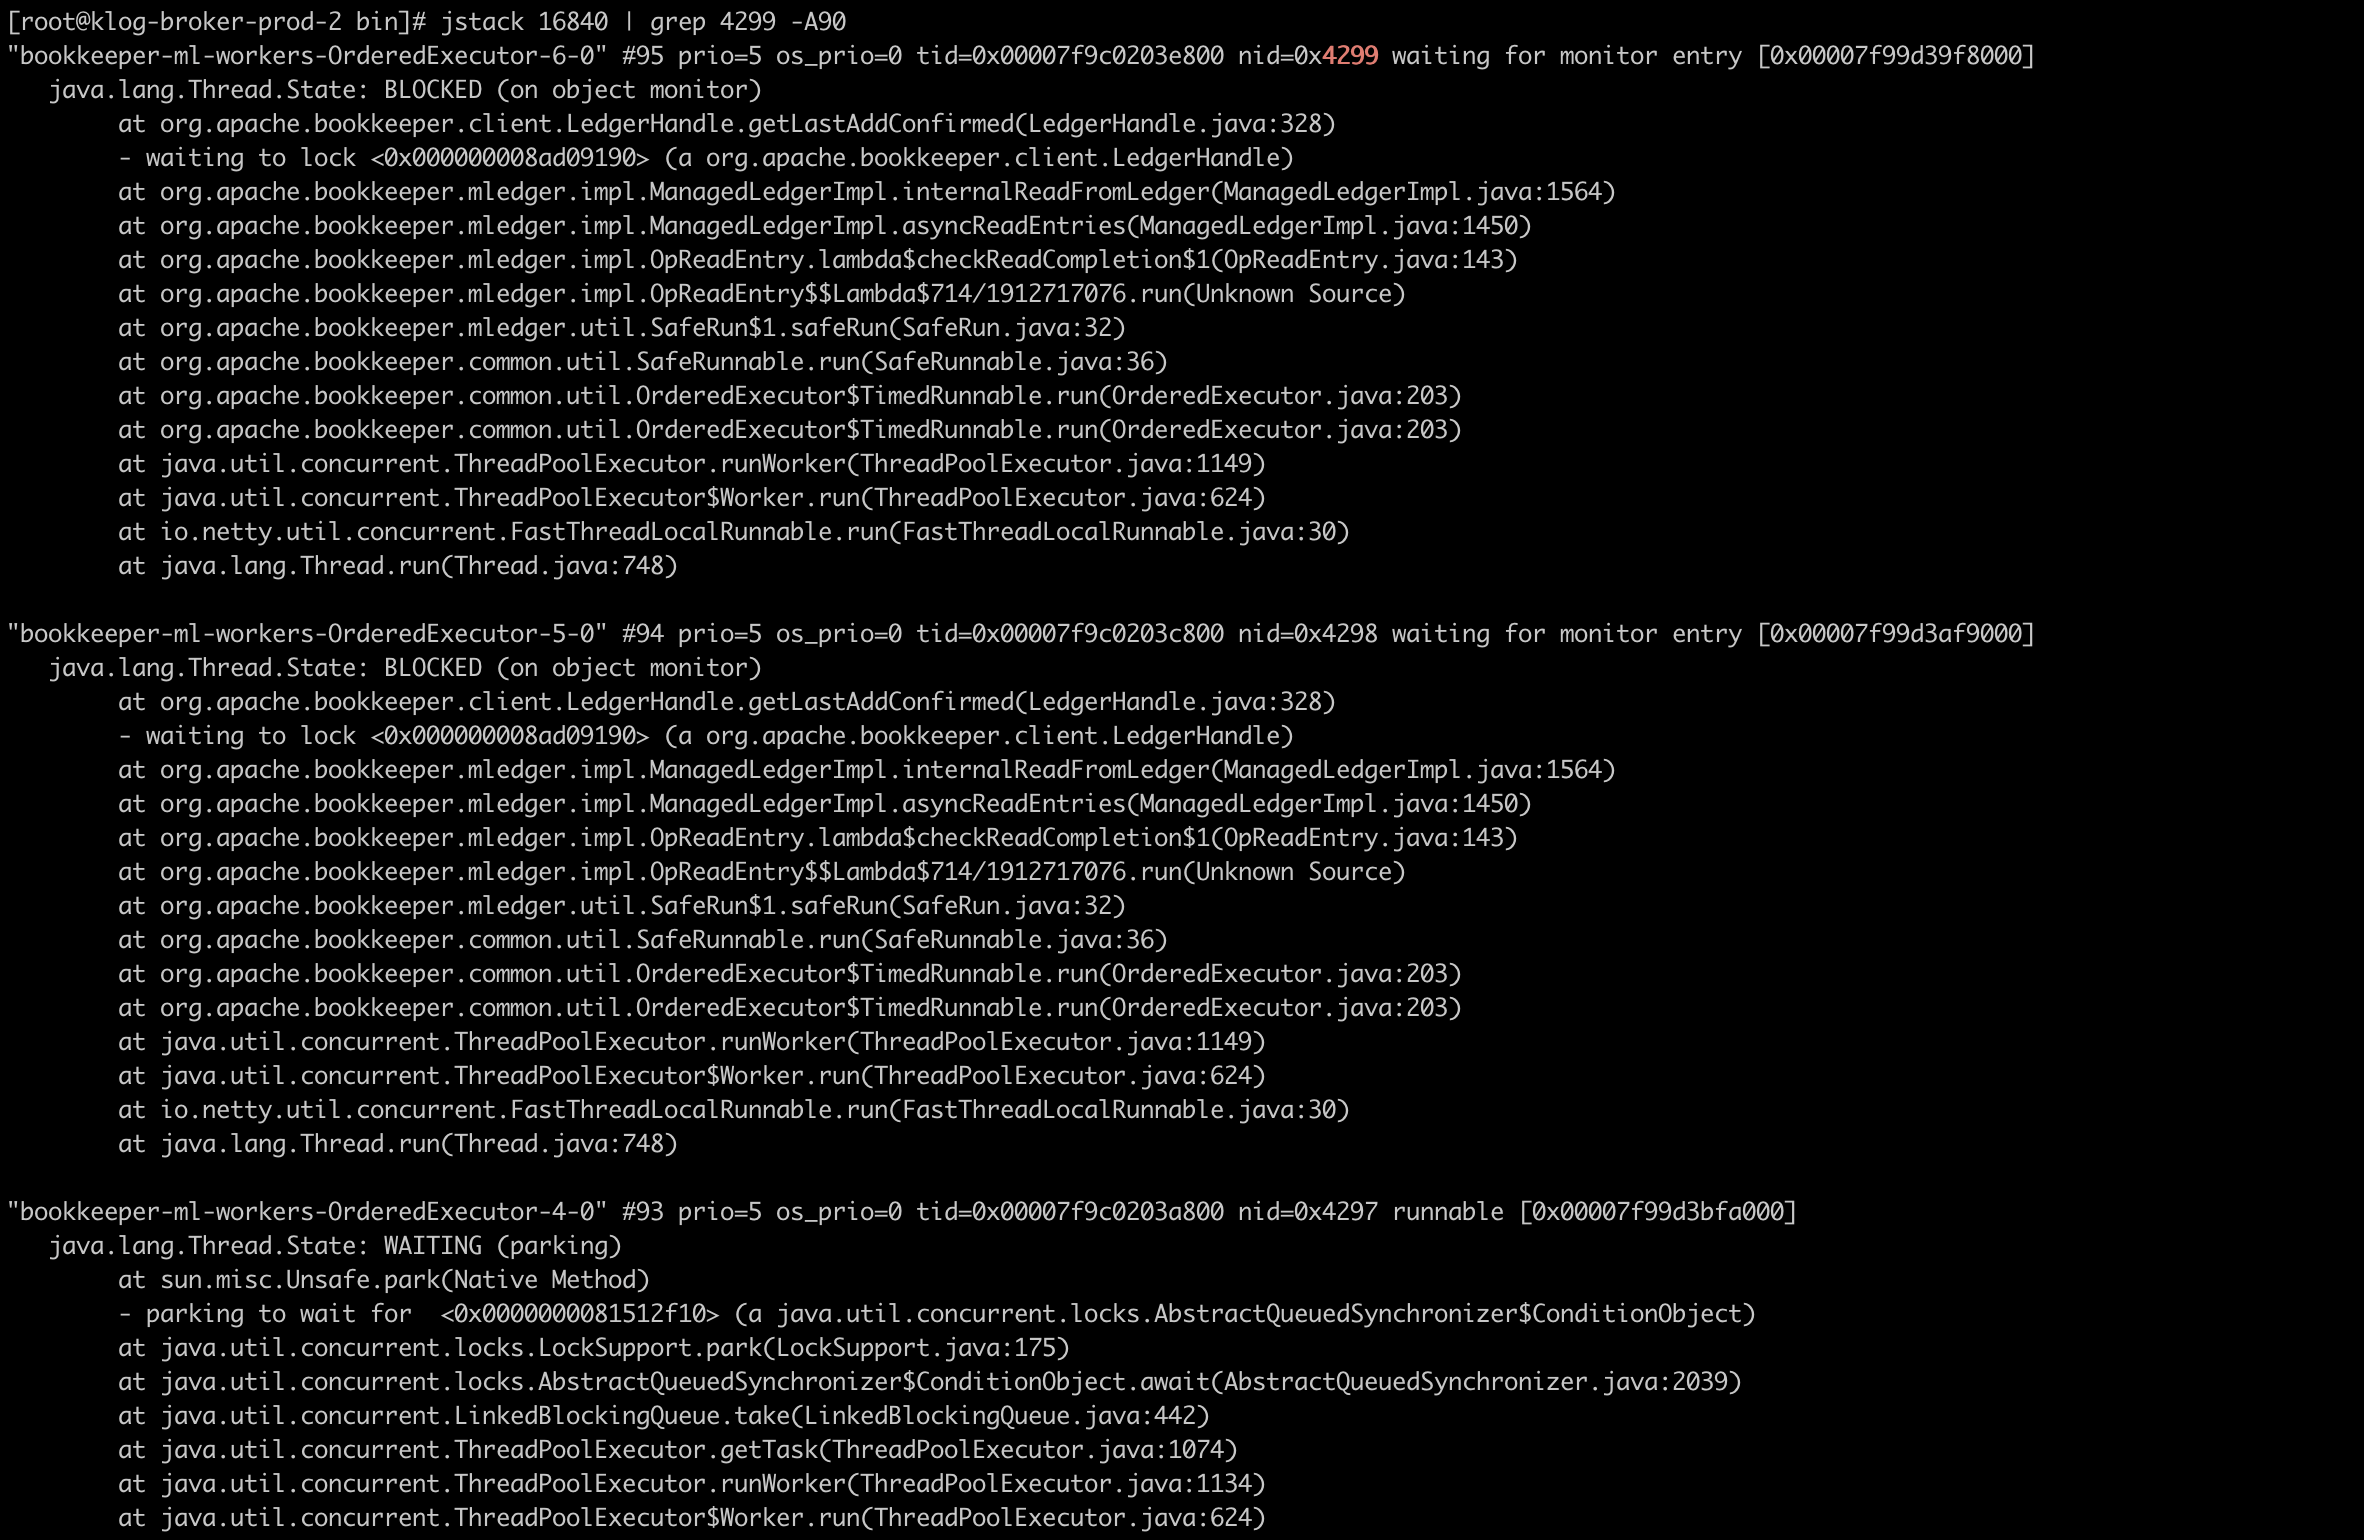
2020-10-08 12:23:51 UTC - Lari Hotari: I'm running into a problem with Pulsar
2.6.1. Under load, the brokers go into a state where the brokers seem to
consume as much CPU they are given. This only stops when the brokers are
restarted. I was able to do some debugging by attaching Async Profiler to the
Pulsar broker process and capture some flame graphs.
The stack frames seem to indicate a tight loop in org/apache/bookkeeper/mledger/impl/OpReadEntry.lambda$checkReadCompletion$1 org/apache/bookkeeper/mledger/impl/ManagedLedgerImpl.asyncReadEntries org/apache/bookkeeper/mledger/impl/ManagedLedgerImpl.internalReadFromLedger org/apache/bookkeeper/mledger/impl/OpReadEntry.checkReadCompletion Has anyone come across a similar issue? I'm wondering if there's any timeout in the retrying condition that is in checkReadCompletion? Could it lead to a never endling loop? <https://github.com/apache/pulsar/blob/3c8fbf7154c9f69ca7033438c12ec0987aadfcb7/managed-ledger/src/main/java/org/apache/bookkeeper/mledger/impl/OpReadEntry.java#L133-L157> ---- 2020-10-08 12:34:56 UTC - John Morrow: @John Morrow has joined the channel ---- 2020-10-08 12:59:55 UTC - Marcio Martins: How does message de-duplication in pulsar work? Is it based on the message key, or on some digest of the message itself? Can't find it in the docs. ---- 2020-10-08 13:19:01 UTC - Lari Hotari: There's only 127 OpReadEntry instances in the heap dump. However the full CPU usage has been going on for hours on the broker. There is no new load on the system and it's been idling. I took several heapdumps and the number of OpReadEntry instances are the same, 127 instances. ---- 2020-10-08 14:03:56 UTC - Sijie Guo: It does sound like that we didn’t handle deleting inactive partitioned topic correctly ---- 2020-10-08 14:04:19 UTC - Sijie Guo: It is based on sequence id ---- 2020-10-08 14:04:56 UTC - Marcio Martins: ok, is the producer setting that on it's own? ---- 2020-10-08 14:05:57 UTC - Marcio Martins: and how is that information stored and persisted, and for how long - is it efficient? ---- 2020-10-08 14:09:07 UTC - Sijie Guo: <https://github.com/apache/pulsar/wiki/PIP-6:-Guaranteed-Message-Deduplication> ---- 2020-10-08 14:09:15 UTC - Sijie Guo: You can check this PIP for more details ---- 2020-10-08 14:10:19 UTC - Sijie Guo: > is the producer setting that on it’s own? Yes. the deduplication is per producer. > how is that information stored and persisted, and for how long - is it efficient? It is using Pulsar’s cursor storage. Each cursor is backed by a ledger in bookkeeper. So it is pretty efficient ---- 2020-10-08 14:11:39 UTC - Marcio Martins: Cool! Thanks! ---- 2020-10-08 14:13:38 UTC - Adriaan de Haan: Hi, so I've been struggling with a problem with message backlog increasing excessively for some time now and I think I have determined under which conditions it is occurring. ---- 2020-10-08 14:14:13 UTC - Adriaan de Haan: I am running pulsar under kubernetes using the provided helm chart for deploying. ---- 2020-10-08 14:15:28 UTC - Adriaan de Haan: When disk space drops to 15% kubernetes freaks out a bit (disk pressure!!!) and tries to reclaim disk space by cleaning up docker and moving some pods away from the node with disk pressure ---- 2020-10-08 14:16:12 UTC - Adriaan de Haan: When this happens, it usually ends up moving one of my brokers to another node (the same node as an existing broker, but that's probably not important). ---- 2020-10-08 14:19:33 UTC - Adriaan de Haan: I have an application (multiple instances actually) running outside kubernetes that connects to the cluster via the Proxy exposed on a nodeport and whenever this broker reshuffling happens the backlog of the subscription being consumed by these applications start increasing - it appears to be consuming fine, the backlog just grows like crazy. ---- 2020-10-08 14:20:24 UTC - Adriaan de Haan: What I've tried to resolve the problem: 1. Redeploy Brokers 2. Redeploy Proxies 3. Restart the application(s) ---- 2020-10-08 14:25:26 UTC - Adriaan de Haan: None of this works - after doing it shows in Grafana "consuming" at about 75TPS for a few seconds, clearing a bit of backlog and after that the consuming goes back to way low and backlog starts increasing again. But what actually worked is to restart the applications at the same time as using ```/bin/pulsar-admin topics skip topic amount``` to completely clear the backlog. After that the consuming keeps going according to Grafana and the backlog remains cleared. Note that the application itself is consuming in all cases with no errors being shown, so it appears to be a problem with the ACK. ---- 2020-10-08 14:33:54 UTC - Adriaan de Haan: Has anybody else experienced a similar problem? Am I doing something fundamentally wrong? Is Pulsar just very sensitive to Brokers restarting? ---- 2020-10-08 14:35:35 UTC - Lari Hotari: I'm trying to understand how the code could get into this infinite loop type of situation. Using Eclipse MAT's OQL to extract information out of the Heapdump. ```SELECT count, entries.size, ((cursor.readPosition.ledgerId.toString() + ":") + cursor.readPosition.entryId.toString()) AS readPosition, ((cursor.ledger.lastConfirmedEntry.ledgerId.toString() + ":") + cursor.ledger.lastConfirmedEntry.entryId.toString()) AS writePosition, classof(cursor).getName() AS "Cursor type", cursor.name.toString() AS "Cursor name" FROM org.apache.bookkeeper.mledger.impl.OpReadEntry ``` ---- 2020-10-08 14:35:46 UTC - Lari Hotari: ---- 2020-10-08 14:36:23 UTC - Lari Hotari: Attempting to extract fields that are used in code at <https://github.com/apache/pulsar/blob/3c8fbf7154c9f69ca7033438c12ec0987aadfcb7/managed-ledger/src/main/java/org/apache/bookkeeper/mledger/impl/OpReadEntry.java#L133-L157> ---- 2020-10-08 14:42:17 UTC - Lari Hotari: This time a screenshot from Yourkit Profiler. It looks like 105 of the 127 instances are circulating in an infinite loop type of situation. I'm guessing that they get re-added to execution when the condition get's evaluated. ---- 2020-10-08 14:48:53 UTC - Sijie Guo: Can you use `topics stats-internal` to get the topic stats to understand why the backlog is growing? ---- 2020-10-08 15:10:01 UTC - Addison Higham: yes ---- 2020-10-08 15:49:18 UTC - Vincent Wong: thanks a lot ---- 2020-10-08 16:35:54 UTC - Adriaan de Haan: this is the current stats: ---- 2020-10-08 16:36:11 UTC - Adriaan de Haan: `oot@pulsar-toolset-0:/pulsar# ./bin/pulsar-admin topics stats-internal <persistent://cerebro/bulksms/smscsend>` `{` `"entriesAddedCounter" : 230881,` `"numberOfEntries" : 30881,` `"totalSize" : 33221499,` `"currentLedgerEntries" : 30881,` `"currentLedgerSize" : 33221499,` `"lastLedgerCreatedTimestamp" : "2020-10-08T15:13:59.133Z",` `"waitingCursorsCount" : 1,` `"pendingAddEntriesCount" : 0,` `"lastConfirmedEntry" : "4168:30880",` `"state" : "LedgerOpened",` `"ledgers" : [ {` `"ledgerId" : 4168,` `"entries" : 0,` `"size" : 0,` `"offloaded" : false` `} ],` `"cursors" : {` `"normal-subscription" : {` `"markDeletePosition" : "4168:30879",` `"readPosition" : "4168:30881",` `"waitingReadOp" : true,` `"pendingReadOps" : 0,` `"messagesConsumedCounter" : 230880,` `"cursorLedger" : 4175,` `"cursorLedgerLastEntry" : 370,` `"individuallyDeletedMessages" : "[]",` `"lastLedgerSwitchTimestamp" : "2020-10-08T16:21:02.413Z",` `"state" : "Open",` `"numberOfEntriesSinceFirstNotAckedMessage" : 2,` `"totalNonContiguousDeletedMessagesRange" : 0,` `"properties" : { }` `}` `}` `}` ---- 2020-10-08 16:57:37 UTC - Mark Mussett: @Mark Mussett has joined the channel ---- 2020-10-08 17:10:07 UTC - Matteo Merli: @Shivji Kumar Jha you can run `pulsar-client-cpp/docker/build-wheels.sh` (or take a look inside) +1 : Shivji Kumar Jha thanks : Shivji Kumar Jha ---- 2020-10-08 17:19:34 UTC - Alexander Brown: Will an offload driver for azure blob storage (tiered storage) be made available in the next release? Otherwise the only helpful documentation (which is outdated) I've found is <https://jclouds.apache.org/guides/azure-storage/> ---- 2020-10-08 17:48:57 UTC - Sijie Guo: there are PRs open to be merged. ---- 2020-10-08 17:49:06 UTC - Sijie Guo: We will include that in next release. raised_hands : Alexander Brown, Shivji Kumar Jha +1 : Ebere Abanonu ---- 2020-10-08 18:49:14 UTC - Nick Rivera: Should I file this as an issue? ---- 2020-10-08 19:07:06 UTC - Marcio Martins: I am having an issue and can't figure out what is going on. Essentially, some of my reads have over 17min latency, as shown in Grafana, and by experiencing long periods of no messages at all on the consumer side. Restarting the bookies seems to alleviate this for a while, but soon it starts again. 2/9 of my bookies are constantly at 100% CPU usage, even after restart, while the remaining are constantly at < 5%. I suspect the 17min latency is related to these bookies, but have no clue how to debug/fix this, outside of sitting here rebooting the bookies every 15 minutes... Any ideas what might be going on? This is 2.5.1 on Kubernetes, 5x broker, 9x bk, 3x zk. ---- 2020-10-08 19:14:17 UTC - Devin G. Bost: Does the retention clock start once a message is acknowledged? Or, if a message has been on the backlog for a while, does it continue to use up its retention period? ---- 2020-10-08 19:52:29 UTC - Addison Higham: retention is based solely on publish timestamp, it sort of has to be that way as a later subscription could reset to earlier and "reset" that clock ---- 2020-10-08 19:53:11 UTC - Devin G. Bost: Thanks! ---- 2020-10-08 19:55:53 UTC - Addison Higham: @Lari Hotari this looks like really interesting data, sorry haven't had a chance to dig in deeper. I will take this to StreamNative team and can dig in, thanks for the thorough report! cc @Sijie Guo ^^ ---- 2020-10-08 20:15:50 UTC - Sijie Guo: What kind of the workload are you running? I see a lot of non-durable cursors there. ---- 2020-10-08 20:17:08 UTC - Sijie Guo: which metric of 17 min latency are you looking into? ---- 2020-10-08 20:18:08 UTC - Addison Higham: He found some earlier issues with readers having memory leaks as well, so I think it does involve lots of short term readers ---- 2020-10-08 20:26:41 UTC - Devin G. Bost: I'd also like to know what issues were encountered ---- 2020-10-08 20:45:57 UTC - Marcio Martins: bookies read entry latency ---- 2020-10-08 20:46:25 UTC - Marcio Martins: I been investigating, and it seems what's triggering it is the auto recovery, somehow if I turn that off, it goes back to normal... ---- 2020-10-08 20:47:58 UTC - Marcio Martins: Looking into the auto-recovery logs, there seems to be a couple of ledgers that are under-replicated, and been failing to replicate since this all started. I inspected the ledgers metadata and indeed, both of these ledgers contain the two failed bookies as part of their ensemble... ---- 2020-10-08 20:50:57 UTC - Marcio Martins: Now, according to the auto-recovery error message, it fails because it times out when reading these ledgers, as it expects a quorum. I suspect these 2 bookies just don't have this ledger, or have it in some bad state... The ensemble had 3, so there is another bookie that should have it... ---- 2020-10-08 21:10:54 UTC - Marcio Martins: When inspecting the metadata, I also see the ledger state is `IN_RECOVERY` - what ideas on how to get out of this mess? This is a very old ledger, likely it has been offloaded to S3, or the topic deleted... ---- 2020-10-08 22:07:42 UTC - Sijie Guo: I would love to learn a bit more about the workload so we can have a better idea how such problem is introduced. So we can have a better direction to fix the problem. ---- 2020-10-08 22:09:01 UTC - Sijie Guo: if read entry latency takes 17 mins, it sound like the whole JVM stop. It most likely would be caused by JVM GC. What cpu and memory did you allocate for bookies? What are the JVM settings you configured for bookies? ---- 2020-10-08 22:14:10 UTC - Marcio Martins: ```-XX:+UseG1GC -XX:+UnlockExperimentalVMOptions -XX:+PerfDisableSharedMem -XX:+ExitOnOutOfMemoryError``` and ```-Xms128m -Xmx256m -XX:MaxDirectMemorySize=768m``` it was dying out of direct memory before so I bumped DM from 512m to 768m ---- 2020-10-08 22:14:37 UTC - Marcio Martins: But would that explain the fact that turning of auto-recovery pods it works fine again? ---- 2020-10-08 22:15:03 UTC - Marcio Martins: The bookie pods goes over 2GB of ram, I think it's memory allocated outside the JVM (rocksDB) ---- 2020-10-08 22:46:41 UTC - Marcio Martins: The ledger issue seems related to <https://github.com/apache/bookkeeper/commit/86f58e8a7269c8e51f246386968ceed051375b8f> - can I fix it manually somehow? I can't upgrade BK to 4.11.0 so stuck with 4.10.0 - is there a way to do it manually? This is the metadata ```ledgerID: 36609 LedgerMetadata{formatVersion=3, ensembleSize=3, writeQuorumSize=2, ackQuorumSize=2, state=IN_RECOVERY, digestType=CRC32C, password=base64:, ensembles={0=[bookie-4.bookie.pulsar.svc.cluster.local:3181, bookie-2.bookie.pulsar.svc.cluster.local:3181, bookie-5.bookie.pulsar.svc.cluster.local:3181]}, customMetadata={pulsar/managed-ledger=base64:cHVibGljL2RlZmF1bHQvcGVyc2lzdGVudC91bml0LWV4cGVyaW1lbnQtZXZlbnRzLXVud3JhcHBlZA==, component=base64:bWFuYWdlZC1sZWRnZXI=, application=base64:cHVsc2Fy}}``` ---- 2020-10-09 03:50:45 UTC - Sijie Guo: they are under replicated probably because the bookie process has a long pause. so autorecovery thinks that the bookie is gone. ---- 2020-10-09 03:51:03 UTC - Sijie Guo: I will not worry about autorecovery at this moment ---- 2020-10-09 03:51:23 UTC - Sijie Guo: If I were you, I will try to figure out why it pauses 17 minutes ---- 2020-10-09 03:51:38 UTC - Sijie Guo: I’d suggest you look into JVM metrics and cpu usage ---- 2020-10-09 03:51:55 UTC - Sijie Guo: I guess you just don’t have enough resources for the bookies pods. ---- 2020-10-09 04:41:28 UTC - Sijie Guo: Yes please ---- 2020-10-09 04:42:17 UTC - Sijie Guo: The stats seems to be fine. ---- 2020-10-09 06:21:26 UTC - Devin G. Bost: Check out my latest video on Apache Pulsar Implementation Patterns & Practices: <https://youtu.be/KTQa1LW3t-g> I cover beginner and advanced material, including some of the latest features of Pulsar. +1 : Lari Hotari, Ali Ahmed, Yunze Xu, tuhaihe, Emil, xiaolong.ran ---- 2020-10-09 06:22:49 UTC - Lari Hotari: Yes there's a lot of different topics (7500 persistent non-partitioned topics in a cluster of 3 zk, 3 bookies and 3 brokers) in the load test that are read with short term readers using the Pulsar Java Client async API. I'll share a more detailed description of the high level use case and the Pulsar work load that it generates later. It might be after my next week's PTO. ---- 2020-10-09 06:29:45 UTC - Lari Hotari: I tried to find similar issues in Github and I did find <https://github.com/apache/pulsar/issues/8078> which has similar symptoms of high CPU and the screenshot in the issue (<https://user-images.githubusercontent.com/13760768/94016891-4d071480-fde1-11ea-99d0-d53a33c2461f.png>) has some common stackframes in the stacktraces (not exactly same stacktraces) that I have been seeing. In my case, I don't notice NPEs in the log. ---- 2020-10-09 06:44:10 UTC - Lari Hotari: @Addison Higham @Sijie Guo here are 7 thread dumps taken over a period of about 24 hrs from a Pulsar broker 2.6.1 when the CPU is high. <https://gist.github.com/lhotari/3256f25a58d8d22b995cfc8d6ed5637d> , download as zip from <https://gist.github.com/lhotari/3256f25a58d8d22b995cfc8d6ed5637d/archive/1525f62a3ad9dc59c54abc30a30134523cb98190.zip> search for "bookkeeper-ml-workers-OrderedExecutor-" to find the interesting details in these stacktraces As also seen in the Flamegraph, this is one of the stack traces that is common: ```"bookkeeper-ml-workers-OrderedExecutor-7-0" #62 prio=5 os_prio=0 tid=0x00007fc6735a8000 nid=0x5d runnable [0x00007fc62b0ad000] java.lang.Thread.State: RUNNABLE at sun.misc.Unsafe.unpark(Native Method) at java.util.concurrent.locks.LockSupport.unpark(LockSupport.java:141) at java.util.concurrent.locks.AbstractQueuedSynchronizer.unparkSuccessor(AbstractQueuedSynchronizer.java:662) at java.util.concurrent.locks.AbstractQueuedSynchronizer.release(AbstractQueuedSynchronizer.java:1264) at java.util.concurrent.locks.ReentrantLock.unlock(ReentrantLock.java:457) at java.util.concurrent.LinkedBlockingQueue.offer(LinkedBlockingQueue.java:427) at java.util.concurrent.ThreadPoolExecutor.execute(ThreadPoolExecutor.java:1371) at com.google.common.util.concurrent.ForwardingExecutorService.execute(ForwardingExecutorService.java:99) at org.apache.bookkeeper.common.util.BoundedExecutorService.execute(BoundedExecutorService.java:89) at com.google.common.util.concurrent.ForwardingExecutorService.execute(ForwardingExecutorService.java:99) at org.apache.bookkeeper.common.util.OrderedExecutor$1.execute(OrderedExecutor.java:341) at org.apache.bookkeeper.common.util.OrderedExecutor.execute(OrderedExecutor.java:651) at org.apache.bookkeeper.mledger.impl.OpReadEntry.checkReadCompletion(OpReadEntry.java:141) at org.apache.bookkeeper.mledger.impl.ManagedLedgerImpl.internalReadFromLedger(ManagedLedgerImpl.java:1586) at org.apache.bookkeeper.mledger.impl.ManagedLedgerImpl.asyncReadEntries(ManagedLedgerImpl.java:1452) at org.apache.bookkeeper.mledger.impl.OpReadEntry.lambda$checkReadCompletion$1(OpReadEntry.java:143) at org.apache.bookkeeper.mledger.impl.OpReadEntry$$Lambda$822/800251664.run(Unknown Source) at org.apache.bookkeeper.mledger.util.SafeRun$1.safeRun(SafeRun.java:32) at org.apache.bookkeeper.common.util.SafeRunnable.run(SafeRunnable.java:36) at org.apache.bookkeeper.common.util.OrderedExecutor$TimedRunnable.run(OrderedExecutor.java:203) at org.apache.bookkeeper.common.util.OrderedExecutor$TimedRunnable.run(OrderedExecutor.java:203) at java.util.concurrent.ThreadPoolExecutor.runWorker(ThreadPoolExecutor.java:1149) at java.util.concurrent.ThreadPoolExecutor$Worker.run(ThreadPoolExecutor.java:624) at io.netty.util.concurrent.FastThreadLocalRunnable.run(FastThreadLocalRunnable.java:30) at java.lang.Thread.run(Thread.java:748)``` ---- 2020-10-09 08:09:09 UTC - Lari Hotari: I'm trying to understand the existing code and how the code could end up in an infinite loop kind of situation. ---- 2020-10-09 08:17:10 UTC - Lari Hotari: these lines look suspicious: <https://github.com/apache/pulsar/blob/e2fbf31ff34f2aa94276ab6103c73cec23849c1b/managed-ledger/src/main/java/org/apache/bookkeeper/mledger/impl/ManagedLedgerImpl.java#L1846-L1849> Since the exception is set, but the execution continues. Is that intentional? /cc @xiaolong.ran (you made the change in <https://github.com/apache/pulsar/commit/c635d08a448f7b2a4868bb6aefc13dd5f17000a1>) That impacts how org.apache.bookkeeper.mledger.impl.OpReadEntry#checkReadCompletion method behaves. I'm not able to verify this yet since I'm simply reading the code together with the information from thread dumps, heap dumps and the flamegraph. I don't currently have the possibility to attach a debugger to the environment where the issue was reproduced and I don't yet have an isolated repro of the issue. ---- 2020-10-09 08:47:18 UTC - Bingo Zhao: @Bingo Zhao has joined the channel ----