Hi all,

Probably best to bring this discussion out of IRC at this point. I've
looked into Varnish performance (from CPU consumption perspective) on
our installations for nearly 3 years, and wanted to share some
findings (as well as some thoughts on how to address these things).
Unfortunately no TL;DR, but maybe it's good to separate these topics.
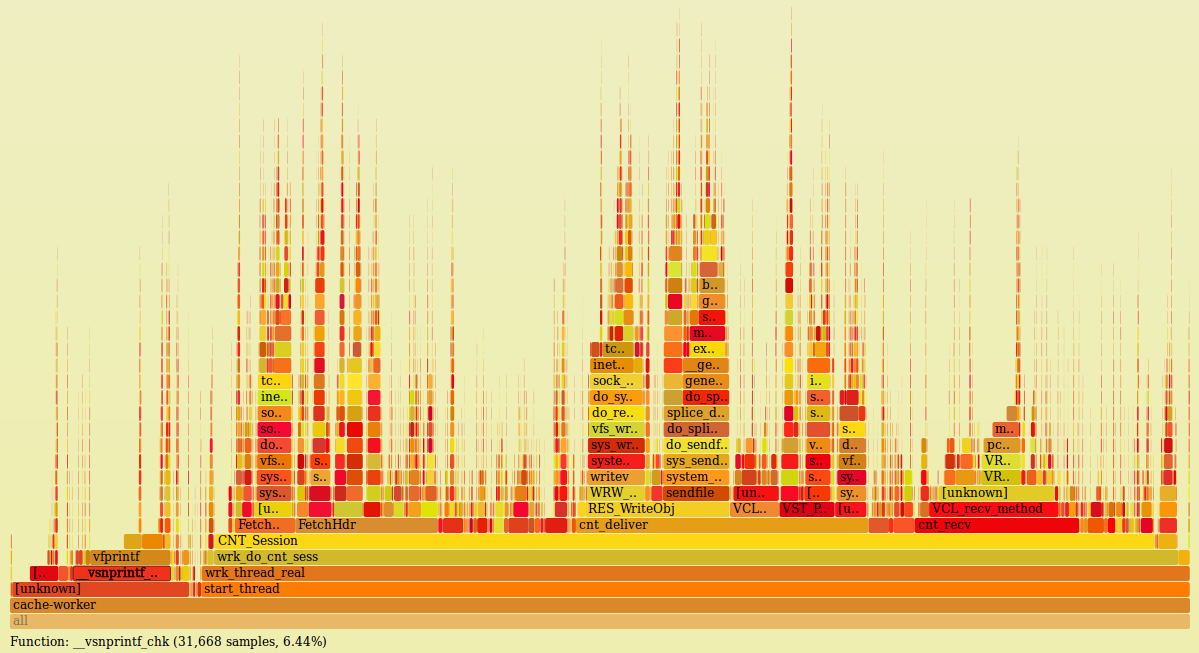
It's going to be a bit before I'm going to have time to do a Varnish 4
test to get numbers -- our fork is based on 2.1.4 and I things do not
line up 1:1. Furthermore, getting noise-free numbers for just Varnish
is difficult for a number of reasons, but effectively I cannot get a
good sample of an individual process due in part to how perf performs
and aggregates its samples, and in part to how many threads we run.
But here are some of the things I've seen as problematic over the last
few years, and ideas for fixing them.

## Header Scanning

The number one CPU hog in Varnish right now outside of PCRE is header
processing. Any header lookup or set is a linear scan, and any
operation on a non-existent header has worst-case time. Any headers
added with VCL become worst-case. Our plan for this turns header
access / modification into O(1):

 a. All headers are accessed from offsetting inside a LUT.
 b. All headers in http_headers.h have a guaranteed slot in the LUT.
 c. VCL-accessed headers are managed at vcc-time and receive slots in
the LUT at initialization-time.
 d. VMODs have an interface such that headers they access outside of
headers defined in http_headers.h or VCL can be registered at
initialization time.

This also provides a means for accessing multiple same-named headers.
We would introduce some VCL syntax to be able to access a specific
header (e.g. beresp.http.Set-Cookie[2]), to get the number of
occurrences of a header of a particular name. An interface would also
exist to be able to apply some function to all headers (possibly also
to all headers matching a specific name). The latter of these is
something we have already -- we've added a "collection" type to VCL,
as well as some functions to apply a function (called a "callback") to
members of the collection. Callbacks operate in a context in which
they are provided a key and value; they are not closures. This has
workspace overhead that I'm not entirely happy with yet, so we have
not made it a generally accessible thing yet.

In the case of multiple headers with the same name, the storage format
would still be a LUT, but the next member for a header would appear
"chained" in some later part of the headers, any offset is defined as
a 3-tuple of (p, q, next). When next is NULL, only one header of a
particular instance appears. Since Varnish bounds the number of
headers that can be handled in a request, this table doesn't have to
be very large and can probably be bounded to (n_known_headers +
max_headers) entries.

## Time Storage as double-precision FP and printf(3)-family

Varnish uses double-precision FP for storing timestamps. The rationale
for this is reasonable: a native type exists that can support
fractional seconds. Arithmetic between two timestamps can be easily
applied in code without relying on APIs that make said arithmetic
difficult to read. This is a good argument for having times stored in
a native format. Unfortunately, there are a few downsides: FP
operations are typically slow, error-prone at a hardware / compiler
level (https://github.com/varnishcache/varnish-cache/issues/1875 as a
recent example), and stringifying floating point numbers correctly is
really hard.

I have just done a measurement of our production Varnish and TIM_foo
functions no longer appear as significant CPU users. I believe this is
because of a change I made a year or two ago in our fork that
snapshots timestamps before calling into VCL. All VRT functions
operate on the same timestamps, and therefore all VCL callbacks appear
to occur at the same time. (This has numerous beneficial properties
and only a few negative ones). Each VCL function gets its own
snapshot.

However, printf(3)-family functions are still super-heavy CPU
consumers, accounting ~6.5% of total CPU time in our Varnish. A third
of this time is spent in `__printf_fp`, which is the glibc function
that handles representation of floating-point values. The *only* thing
Varnish really uses FP for is doubles; it's logical to assume without
doing a full audit is that something like 20% of printf(3)-family time
is spent converting double-precision numbers to strings and the
majority of the remaining time is format string parsing. From this
perspective, it is still worth it to analyze the performance of
VTIM-family functions to get an idea of their overhead:

 1. TIM_real in our tree showed up in top functions of a synthetic,
all-hit workload. Annotating the function shows where samples saw most
of the time spent. In this sample, we can see that nearly 2/3ds of the
time is spent in setting up the call stack and 1/3 of the time is
doing FP-ops.

      │    000000000000aec0 <TIM_real>:
 36.20 │      sub    $0x18,%rsp
 26.70 │      xor    %edi,%edi
       │      mov    %rsp,%rsi
...
  1.81 │40:   cvtsi2 0x8(%rsp),%xmm1
 10.86 │      mulsd  0x8511(%rip),%xmm1        # 13420 <__func__.5739+0x13>
 19.00 │      cvtsi2 (%rsp),%xmm0

 2. Other time-related functions have FP-dominating components.
TIM_format, for example, is dominated by nearly 2/3rds of its time on
a single FP instruction (this is probably partially due to pipeline
stalling).

       │    000000000000ae40 <TIM_format>:
 62.16 │      cvttsd %xmm0,%rax

Inlining these functions would be beneficial in the TIM_real (sorry, I
am still operating in V2 terminology, but I believe all of this still
applies to V4) sense, but moving away from double as a time storage
format would be beneficial in general. This would be done by using
64-bit counters that represent the number of nanoseconds since the
epoch. We will run out of those in something like 540 years, and I'm
happy to make that someone else's problem :).

 a. It reduces significant portion of overhead in VTIM-family functions
 b. It reduces significant portion of overhead in printf
 c. It maintains composability of time arithmetic

The major downside is that timestamp printing now needs additional
work to print fractional time components.

Finally, this gets a little into printf(3)-family inefficiencies as
well. Because it parses format strings every time, we've optimized a
number of places where we were using sprintf(3)-like interfaces to
simply use string buffers. There is VSB of course, but we also use
https://github.com/dhobsd/vstring (partially for FP stuff, partially
for allowing static-backed buffers to upgrade to dynamic ones if
necessary). The code overhead of string building is unfortunate, but
at 6.5% overhead to use printf(3), this is a real win. (Some of the
unlabeled blocks are things like _IO_default_xsputn, so the overhead
of printf(3) here is likely still higher than 6.5%). See
https://9vx.org/images/fg.png -- this was taken on a machine that is
handling nearly 12k RPS on top of ~3-4k threads. By moving to integer
times, conversion and printing would likely reduce the overhead of
printf(3) by 20% without actually changing consumption of printf.

I am unclear how this applies to Varnish 4, but I think relatively
little is changed in this context between the versions.

## PCRE

There are other things we've done (like optimizing regexes that are
obviously prefix and suffix matches -- turns out lots of people write
things like `if (req.http.x-foo ~ "^bar.*$")` that are effectively `if
(strncmp(req.http.x-foo, "bar" 3))` because it's easy), but I don't
see those as being as high priority for upstream; they're largely
issues for our multi-tenant use case. We have done this already;
another thing we would like to do is to check regexes for things like
backtracking and use DFA-based matching where possible. In the flame
graph screenshot, the obvious VRT functions are PCRE.

## Expected Impact

The expected impact of fixing these things is almost purely in
latency. For this machine handling 12k RPS, that is the constant
throughput bound, but we are bursting up to nearly 4k threads to serve
the load. If header processing, PCRE, and printf were reduced to 50%
of their current overhead, we'd expect to be able to handle the same
load with something like 350 fewer threads, which is a real win for
us. Note than even our 99%ile latency is largely covered by cache
hits, so these effects would improve service for the vast majority of
requests.

Anyway, those are some thoughts. Looking forward to comments, though
maybe there's a better venue for that than this ML?

--dho

_______________________________________________
varnish-dev mailing list
[email protected]
https://www.varnish-cache.org/lists/mailman/listinfo/varnish-dev