Thanks for all the info, all of you.

I'm wondering, H/2 mandates lower-case for headers, allowing us to get rid
of strncmp, and in addition, the name length is known, so checking for
equality boils down to a memcmp. Would that affect the results you are
seing, Devon? I'm genuinely curious about the memory/speed balance of both
the LUT and the simple list we have, specially for "small" (<20?) sets of
headers.
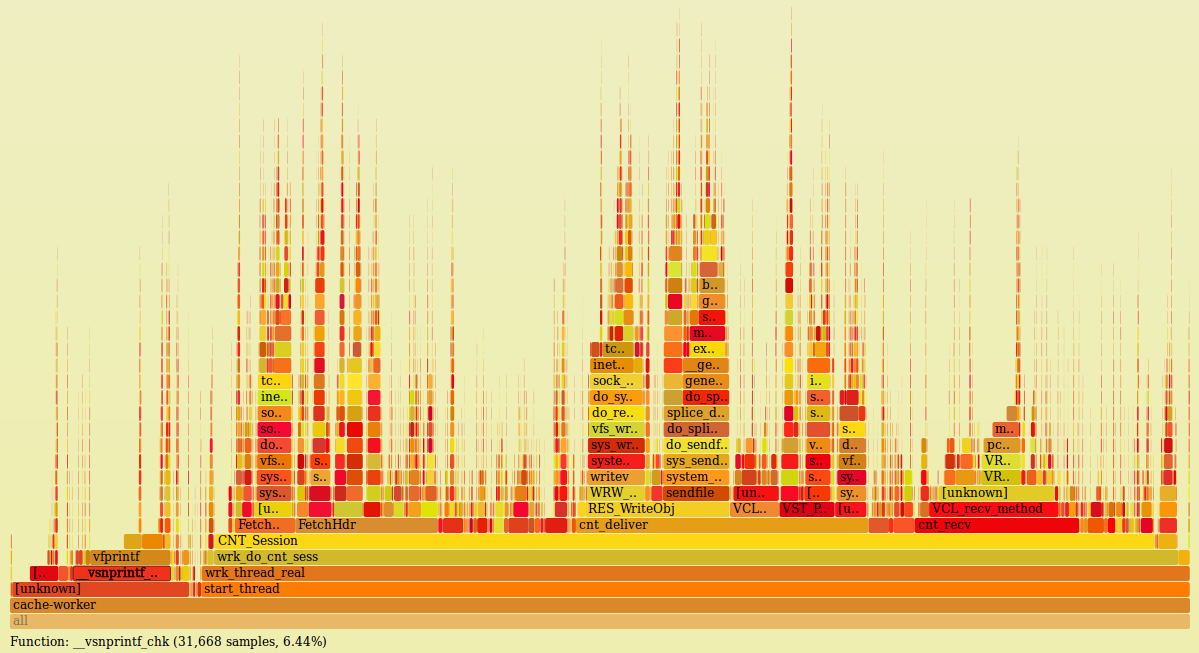
Also, H/2 makes it an error to send two same-named headers, except for
cookies (exceptions are fun!), so I'm wondering if the section about
duplicate headers is worth it (again, I'm not judging, really asking).

--
Guillaume Quintard

On Wed, Apr 6, 2016 at 2:46 PM, Federico Schwindt <[email protected]> wrote:

> Hi,
>
> I'm all for the LUT idea and I think it makes even more sense when you
> consider H/2.
>
> Having the same timestamp during a particular method also makes sense.
> I believe we only need to change now calls to use ctx->now instead of
> getting the time on each call but haven't looked into detail.
>
> Being a bit smarter wrt some regular expressions might also be a good
> idea, specially for cases like the one you mentioned.
> FWIW, we have re-enabled JIT in recent Varnish versions for PCRE >= 8.32.
> Perhaps it's worth checking if this provides any benefit before we consider
> optimizing the custom patterns.
>
> On Mon, Apr 4, 2016 at 8:21 PM, Devon H. O'Dell <[email protected]> wrote:
>
>> Hi all,
>>
>> Probably best to bring this discussion out of IRC at this point. I've
>> looked into Varnish performance (from CPU consumption perspective) on
>> our installations for nearly 3 years, and wanted to share some
>> findings (as well as some thoughts on how to address these things).
>> Unfortunately no TL;DR, but maybe it's good to separate these topics.
>>
>> It's going to be a bit before I'm going to have time to do a Varnish 4
>> test to get numbers -- our fork is based on 2.1.4 and I things do not
>> line up 1:1. Furthermore, getting noise-free numbers for just Varnish
>> is difficult for a number of reasons, but effectively I cannot get a
>> good sample of an individual process due in part to how perf performs
>> and aggregates its samples, and in part to how many threads we run.
>> But here are some of the things I've seen as problematic over the last
>> few years, and ideas for fixing them.
>>
>> ## Header Scanning
>>
>> The number one CPU hog in Varnish right now outside of PCRE is header
>> processing. Any header lookup or set is a linear scan, and any
>> operation on a non-existent header has worst-case time. Any headers
>> added with VCL become worst-case. Our plan for this turns header
>> access / modification into O(1):
>>
>>  a. All headers are accessed from offsetting inside a LUT.
>>  b. All headers in http_headers.h have a guaranteed slot in the LUT.
>>  c. VCL-accessed headers are managed at vcc-time and receive slots in
>> the LUT at initialization-time.
>>  d. VMODs have an interface such that headers they access outside of
>> headers defined in http_headers.h or VCL can be registered at
>> initialization time.
>>
>> This also provides a means for accessing multiple same-named headers.
>> We would introduce some VCL syntax to be able to access a specific
>> header (e.g. beresp.http.Set-Cookie[2]), to get the number of
>> occurrences of a header of a particular name. An interface would also
>> exist to be able to apply some function to all headers (possibly also
>> to all headers matching a specific name). The latter of these is
>> something we have already -- we've added a "collection" type to VCL,
>> as well as some functions to apply a function (called a "callback") to
>> members of the collection. Callbacks operate in a context in which
>> they are provided a key and value; they are not closures. This has
>> workspace overhead that I'm not entirely happy with yet, so we have
>> not made it a generally accessible thing yet.
>>
>> In the case of multiple headers with the same name, the storage format
>> would still be a LUT, but the next member for a header would appear
>> "chained" in some later part of the headers, any offset is defined as
>> a 3-tuple of (p, q, next). When next is NULL, only one header of a
>> particular instance appears. Since Varnish bounds the number of
>> headers that can be handled in a request, this table doesn't have to
>> be very large and can probably be bounded to (n_known_headers +
>> max_headers) entries.
>>
>> ## Time Storage as double-precision FP and printf(3)-family
>>
>> Varnish uses double-precision FP for storing timestamps. The rationale
>> for this is reasonable: a native type exists that can support
>> fractional seconds. Arithmetic between two timestamps can be easily
>> applied in code without relying on APIs that make said arithmetic
>> difficult to read. This is a good argument for having times stored in
>> a native format. Unfortunately, there are a few downsides: FP
>> operations are typically slow, error-prone at a hardware / compiler
>> level (https://github.com/varnishcache/varnish-cache/issues/1875 as a
>> recent example), and stringifying floating point numbers correctly is
>> really hard.
>>
>> I have just done a measurement of our production Varnish and TIM_foo
>> functions no longer appear as significant CPU users. I believe this is
>> because of a change I made a year or two ago in our fork that
>> snapshots timestamps before calling into VCL. All VRT functions
>> operate on the same timestamps, and therefore all VCL callbacks appear
>> to occur at the same time. (This has numerous beneficial properties
>> and only a few negative ones). Each VCL function gets its own
>> snapshot.
>>
>> However, printf(3)-family functions are still super-heavy CPU
>> consumers, accounting ~6.5% of total CPU time in our Varnish. A third
>> of this time is spent in `__printf_fp`, which is the glibc function
>> that handles representation of floating-point values. The *only* thing
>> Varnish really uses FP for is doubles; it's logical to assume without
>> doing a full audit is that something like 20% of printf(3)-family time
>> is spent converting double-precision numbers to strings and the
>> majority of the remaining time is format string parsing. From this
>> perspective, it is still worth it to analyze the performance of
>> VTIM-family functions to get an idea of their overhead:
>>
>>  1. TIM_real in our tree showed up in top functions of a synthetic,
>> all-hit workload. Annotating the function shows where samples saw most
>> of the time spent. In this sample, we can see that nearly 2/3ds of the
>> time is spent in setting up the call stack and 1/3 of the time is
>> doing FP-ops.
>>
>>       │    000000000000aec0 <TIM_real>:
>>  36.20 │      sub    $0x18,%rsp
>>  26.70 │      xor    %edi,%edi
>>        │      mov    %rsp,%rsi
>> ...
>>   1.81 │40:   cvtsi2 0x8(%rsp),%xmm1
>>  10.86 │      mulsd  0x8511(%rip),%xmm1        # 13420
>> <__func__.5739+0x13>
>>  19.00 │      cvtsi2 (%rsp),%xmm0
>>
>>  2. Other time-related functions have FP-dominating components.
>> TIM_format, for example, is dominated by nearly 2/3rds of its time on
>> a single FP instruction (this is probably partially due to pipeline
>> stalling).
>>
>>        │    000000000000ae40 <TIM_format>:
>>  62.16 │      cvttsd %xmm0,%rax
>>
>> Inlining these functions would be beneficial in the TIM_real (sorry, I
>> am still operating in V2 terminology, but I believe all of this still
>> applies to V4) sense, but moving away from double as a time storage
>> format would be beneficial in general. This would be done by using
>> 64-bit counters that represent the number of nanoseconds since the
>> epoch. We will run out of those in something like 540 years, and I'm
>> happy to make that someone else's problem :).
>>
>>  a. It reduces significant portion of overhead in VTIM-family functions
>>  b. It reduces significant portion of overhead in printf
>>  c. It maintains composability of time arithmetic
>>
>> The major downside is that timestamp printing now needs additional
>> work to print fractional time components.
>>
>> Finally, this gets a little into printf(3)-family inefficiencies as
>> well. Because it parses format strings every time, we've optimized a
>> number of places where we were using sprintf(3)-like interfaces to
>> simply use string buffers. There is VSB of course, but we also use
>> https://github.com/dhobsd/vstring (partially for FP stuff, partially
>> for allowing static-backed buffers to upgrade to dynamic ones if
>> necessary). The code overhead of string building is unfortunate, but
>> at 6.5% overhead to use printf(3), this is a real win. (Some of the
>> unlabeled blocks are things like _IO_default_xsputn, so the overhead
>> of printf(3) here is likely still higher than 6.5%). See
>> https://9vx.org/images/fg.png -- this was taken on a machine that is
>> handling nearly 12k RPS on top of ~3-4k threads. By moving to integer
>> times, conversion and printing would likely reduce the overhead of
>> printf(3) by 20% without actually changing consumption of printf.
>>
>> I am unclear how this applies to Varnish 4, but I think relatively
>> little is changed in this context between the versions.
>>
>> ## PCRE
>>
>> There are other things we've done (like optimizing regexes that are
>> obviously prefix and suffix matches -- turns out lots of people write
>> things like `if (req.http.x-foo ~ "^bar.*$")` that are effectively `if
>> (strncmp(req.http.x-foo, "bar" 3))` because it's easy), but I don't
>> see those as being as high priority for upstream; they're largely
>> issues for our multi-tenant use case. We have done this already;
>> another thing we would like to do is to check regexes for things like
>> backtracking and use DFA-based matching where possible. In the flame
>> graph screenshot, the obvious VRT functions are PCRE.
>>
>> ## Expected Impact
>>
>> The expected impact of fixing these things is almost purely in
>> latency. For this machine handling 12k RPS, that is the constant
>> throughput bound, but we are bursting up to nearly 4k threads to serve
>> the load. If header processing, PCRE, and printf were reduced to 50%
>> of their current overhead, we'd expect to be able to handle the same
>> load with something like 350 fewer threads, which is a real win for
>> us. Note than even our 99%ile latency is largely covered by cache
>> hits, so these effects would improve service for the vast majority of
>> requests.
>>
>> Anyway, those are some thoughts. Looking forward to comments, though
>> maybe there's a better venue for that than this ML?
>>
>> --dho
>>
>> _______________________________________________
>> varnish-dev mailing list
>> [email protected]
>> https://www.varnish-cache.org/lists/mailman/listinfo/varnish-dev
>
>
>
> _______________________________________________
> varnish-dev mailing list
> [email protected]
> https://www.varnish-cache.org/lists/mailman/listinfo/varnish-dev
>
_______________________________________________
varnish-dev mailing list
[email protected]
https://www.varnish-cache.org/lists/mailman/listinfo/varnish-dev