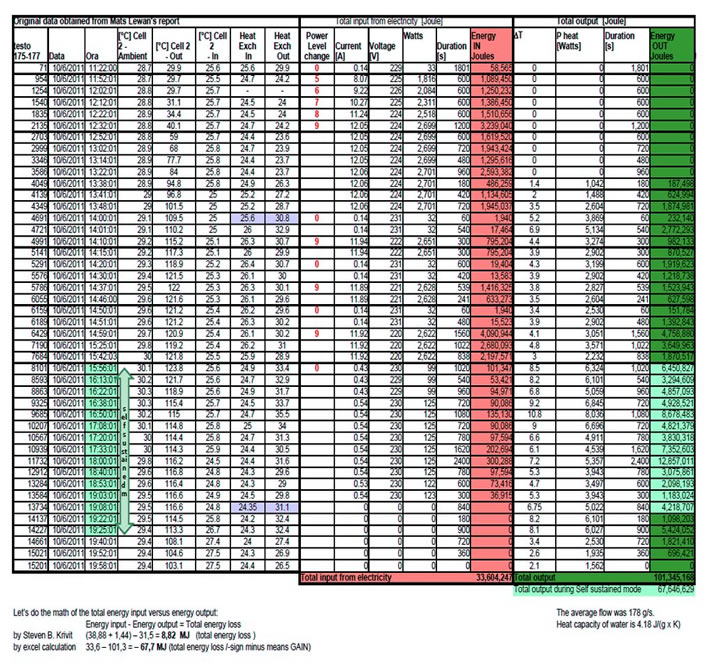
Spreadsheet similar to
http://lenr.qumbu.com/111010_pics/i_imagur_HwxRTh.png
Plot similar to this, but  with eCat T2 superimposed?
http://i.imgur.com/uFCJg.jpg
(Horace's published spreadsheet has everything except T2 -- thanks for all your work, btw)
Spreadsheet similar to http://lenr.qumbu.com/111010_pics/i_imagur_HwxRTh.png
Plot similar to this, but with eCat T2 superimposed? http://i.imgur.com/uFCJg.jpg(Horace's published spreadsheet has everything except T2 -- thanks for all your work, btw)