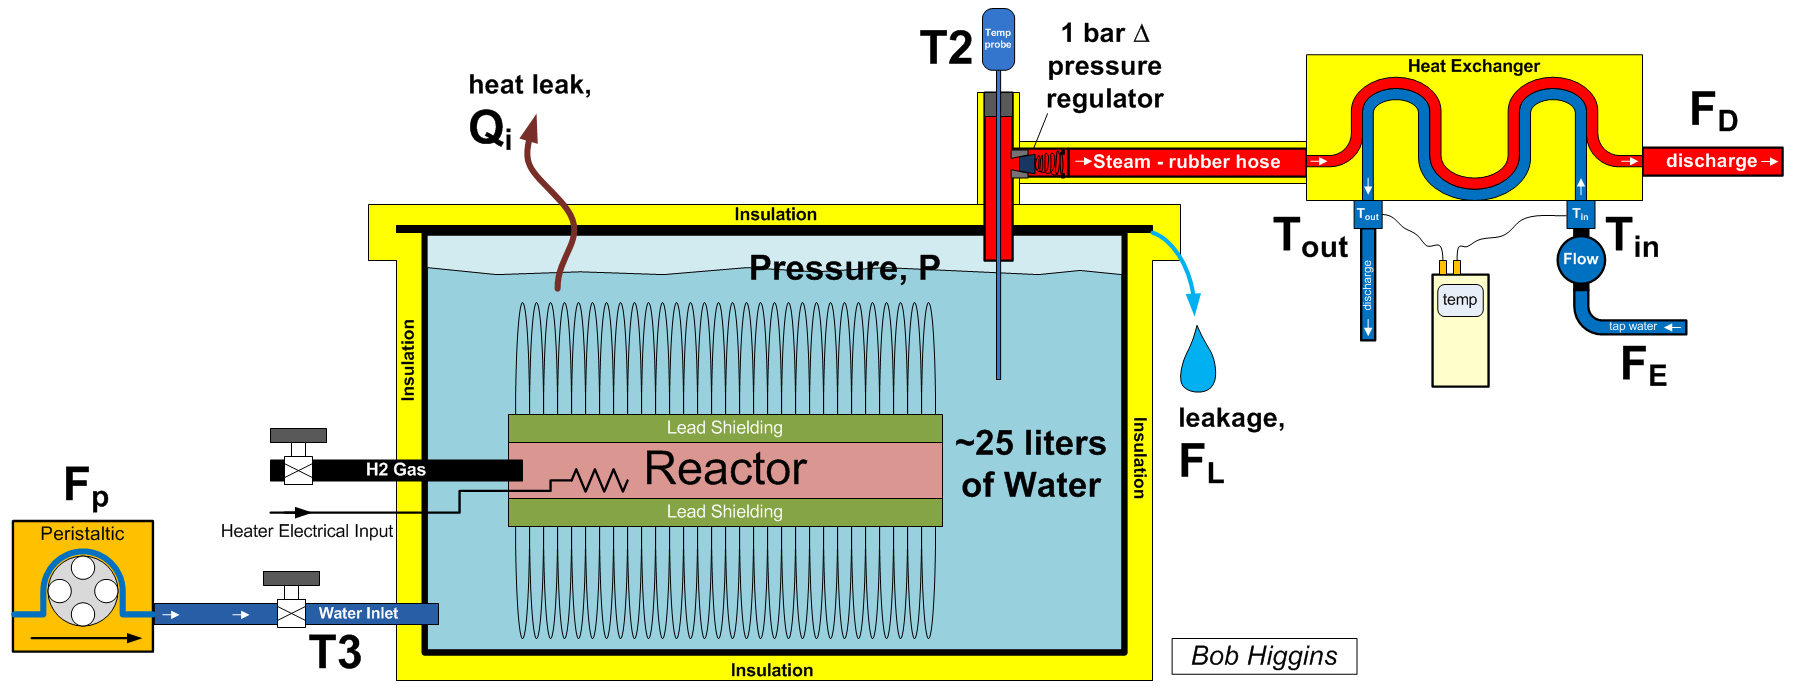
This is a very nice diagram. However, as I showed in the "T2
THERMOCOUPLE LOCATION" in:
http://www.mtaonline.net/~hheffner/Rossi6Oct2011Review.pdf
the center of the thermocouple comes down precisely on the edge of
the fins.
On Oct 14, 2011, at 10:34 AM, Alan J Fletcher wrote:
Bob Higgins sent me a higher-resolution diagram which I'm hosting at :
http://lenr.qumbu.com/111010_pics/Rossi27kwReactorDiagram_lg.png

The T2 probe length has been increased to reflect recent discussions.
ps If anyone needs image hosting, I've got plenty of storage. Just
send me a pic and I'll put it up.
At 07:47 AM 10/14/2011, azat avetisyan wrote:
Hi Alan
Could you please send me Mr Higgins higher-res version of fat-
cat's diagram. Please tell him thank you for this wonderful
diagram, now I could understand looking on diagram, how e-cat's
work. Also, thank you for your website, it's excellent information
and analysis source.
Thanks
Azat
You're welcome.
Best regards,

Horace Heffner
http://www.mtaonline.net/~hheffner/