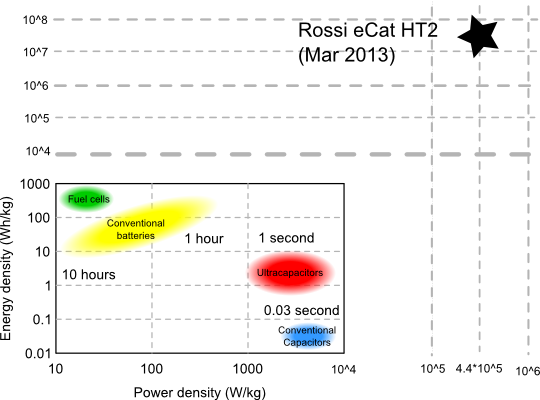
I found an svg file with sample Rogone plots ... and superimposed the Dec test
on it
Equations 34 and 35

http://www.well.com/~af/ecat_dec_chart_130520A.png


(Gee whiz : the COP came out the way we calculated it!)
I found an svg file with sample Rogone plots ... and superimposed the Dec test on it
Equations 34 and 35 http://www.well.com/~af/ecat_dec_chart_130520A.png (Gee whiz : the COP came out the way we calculated it!)