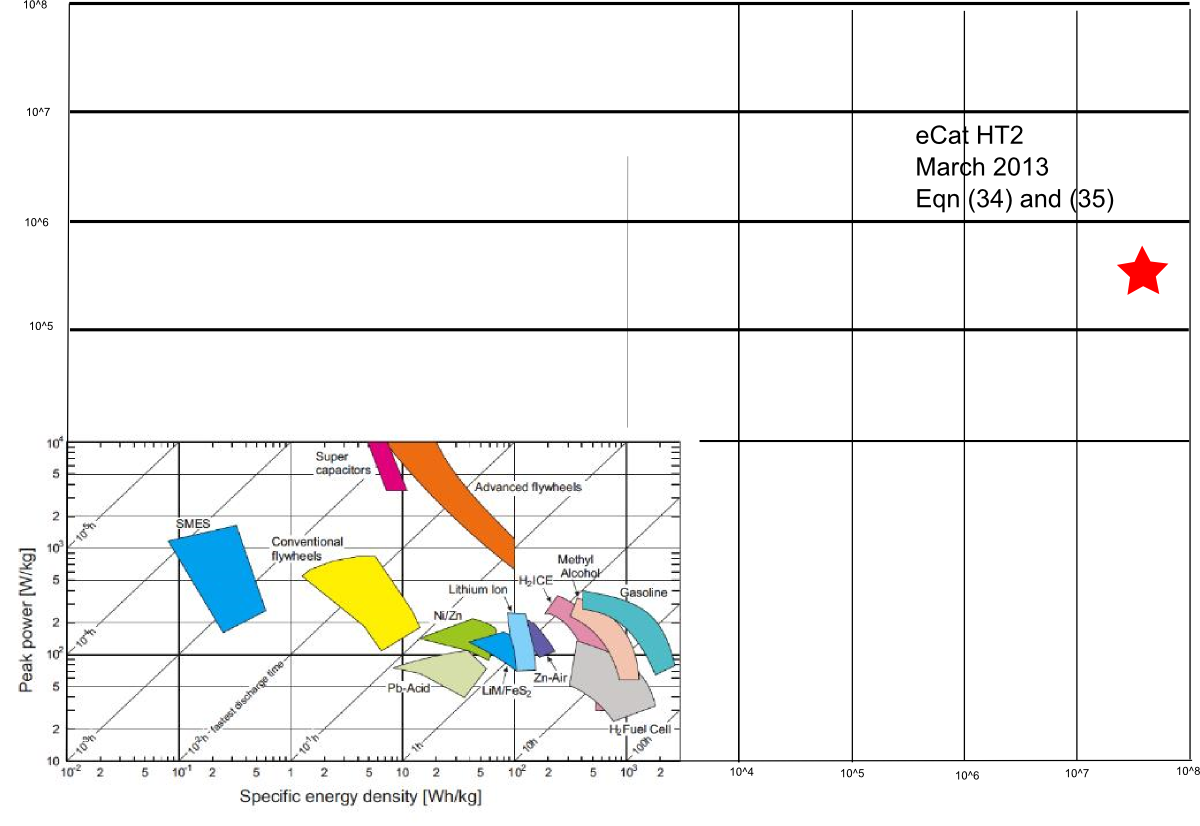
In reply to  Alan Fletcher's message of Mon, 20 May 2013 10:57:44 -0700 (PDT):
Hi,
[snip]
>Updated Ragone Plot ---   for the March test
>
>Power density = (4.4 ± 0.4) · 10^5  [W/kg] (34)
>Energy density = (5.1 ± 0.5) · 10^7 [Wh/kg] (35)
>
>http://lenr.qumbu.com/ragone_lawrenceliv_ecat_130520.png
>
>(Note that the axes are reversed from the version used in the paper.)
>
>I got it from http://davisstraub.com/OZ/1236003460 -- who indicates that the
>original is from Lawrence Livermore.
>I used this one because it has good resolution and clear axes.
Just a small BTW. The value for gasoline is probably wrong. The value for pure
octane is 10.737 kWh/kg. Other values may be found at
http://hypertextbook.com/facts/2003/ArthurGolnik.shtml.
All values exceed 10000 Wh/kg. The highest value actually on the chart is about
3-4000 Wh/kg.
The chart also shows a range of about a factor of 10 from the lowest energy
density to the highest, which I find very unlikely.

Also the whole concept of "peak power"/kg should be taken with a grain of salt,
because it depends on the means by which the energy is released.
e.g. a gas turbine would differ from a reciprocating engine. (There is little
difference in energy density between avgas and normal gasoline.)

Just for the sake of comparison, the most advanced "flywheel" is probably an
electron whizzing around an atom. For the Hydrogen atom, that yields an energy
density of 362000 Wh/kg. :)

Regards,

Robin van Spaandonk

http://rvanspaa.freehostia.com/project.html