I want to set yscale for barometer plots so that it's a fixed range, so I
put something like
[[[[barometer]]]]
yscale = 900, 1050, 10
in the [ImageGenerator] section
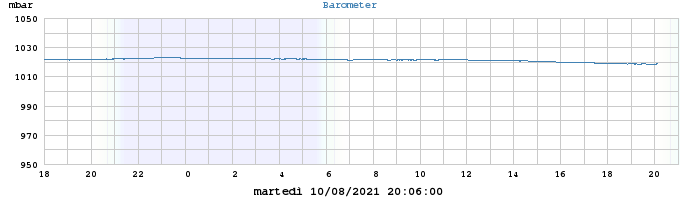
I expressed the values in millibar, which is the unit used in the plots.
However, the automatic yscale is
used: http://weewx.qumran2.net/daybarometer.png
What am I missing?
--
You received this message because you are subscribed to the Google Groups
"weewx-user" group.
To unsubscribe from this group and stop receiving emails from it, send an email
to [email protected].
For more options, visit https://groups.google.com/d/optout.