Thanks for your intrest in my problem. I do have two major changes within
section [imagegenerator]. I've increased the image_width from 500 to 600.
And I've added a second line within some images to include forcast data
from a different database like e.g.
        [[[daybarometer]]]
            [[[[barometer]]]]
            [[[[forecast_barometer]]]]
                data_type = barometer
                data_binding = dwd_binding
label = ' '
color = blue
And to draw that forecast data I use my new option "time_offset = 36000  #
10 hours". It's intention is to use the additional 100pixel to be filled by
forecast.
See my full skin.conf appended here.
Regards, Michael


gjr80 schrieb am Montag, 1. Januar 2024 um 21:46:42 UTC+1:

> Thank you, so that is the code, just need the plot definition. In fact,
> the entire [ImageGenerator] stanza from the config file in use would be
> best.
>
> Gary
>
> On Monday 1 January 2024 at 23:19:52 UTC+10 [email protected] wrote:
>
>> My code is available as a (rejected) pull request
>> https://github.com/weewx/weewx/pull/906 - but the code itself works
>> fine. It enhances the timescale some days into the future to plot forecast
>> data. See my first post for a sample (only forecast data is plotted,
>> measurement data are missing). I assume that my change has a sideeffect
>> when weewx checks if there is data to be drawn. But I have no idea why my
>> problem only arise for the measurement data. From the sample you clearly
>> see that the forecast data contains data from 2023 and 2024, and is
>> plotted. The measuretdata of course only contains data from the past. And
>> even images where no forecast data is to be plotted (e. g dayUV) are
>> missing completely, as soon as the timescale has parts in 2024 and current
>> time is 2023.
>>
>> And the problem is difficult to reproduce - as soon as the measurement
>> data has reached 2024, even images generated for old times are fine.
>>
>> gjr80 schrieb am Montag, 1. Januar 2024 um 11:19:42 UTC+1:
>>
>>> I suspect you will not get too much feedback of value until you post the
>>> exact code you are using along with the plot definition from skin.conf. The
>>> post you linked is very general in nature and it's not clear if the code
>>> you are using is that same as the PRs you submitted or otherwise. I am
>>> happy to have a look through your code but I don't want to be chasing my
>>> tail or going down the wrong path.
>>>
>>> Gary
>>> On Monday 1 January 2024 at 18:10:10 UTC+10 [email protected]
>>> wrote:
>>>
>>>> As expected all images are fine as soon as current time has reached the
>>>> new year 2024. To be more precise - it has to be 5 min past midnight
>>>> before
>>>> the images are fine.
>>>>
>>>> I've  tried to understand the logic within imagegenerator.py near its
>>>> call of scaletime. Since the x-axis is labelled fine & day/night rendering
>>>> works I assume that x_domain is calculated correctly.
>>>> There is a loop over all line_name - it might miss the entry for
>>>> measured data. Here I should debug, but:
>>>>
>>>> I've tried to reproduce my problems using e.g.
>>>>
>>>> sudo wee_reports --date=2023-12-31 --time=22:00
>>>>
>>>> Now it is generated perfectly as expected. Of course I do no longer
>>>> have the same input data - the measurement data now is available for times
>>>> within 2024, and the forecast data is more recent. Thus it's more
>>>> difficult
>>>> to reproduce the problem - I've to use older weewx.sdb (luckily I do have
>>>> a
>>>> recent backup)....
>>>>
>>>> BTW Happy new year, Michael
>>>>
>>>> Michael Waldor schrieb am Sonntag, 31. Dezember 2023 um 20:05:58 UTC+1:
>>>>
>>>>> I would agree, but why is the forecast data drawn fine and only the
>>>>> measured data not? My change to scaletime only calculates the time range
>>>>> -
>>>>> and that looks fine to me (see the included image within my first post).
>>>>> scaletime does return a triple of data - start, stop, and stepwidth.
>>>>> Works
>>>>> fine for forecast. AND works fine if there is no change of the year. I
>>>>> assume furthermore that scaletime does not use any global variables. But
>>>>> your program is very clean designed, thus I do not expect, that scaletime
>>>>> could create sideeffects. Tomorrow I'll know more...
>>>>>
>>>>> Tom Keffer schrieb am Sonntag, 31. Dezember 2023 um 16:40:55 UTC+1:
>>>>>
>>>>>> Your modified version of scaletime() is surely causing the problem.
>>>>>> Its semantics were never clear to me, and now it appears we're
>>>>>> discovering
>>>>>> the side effects.
>>>>>>
>>>>>> If you have a debugger, use it to step through running wee_reports.
>>>>>> It will probably become evident what the problem is.
>>>>>>
>>>>>> On Sun, Dec 31, 2023 at 7:17 AM 'Michael Waldor' via weewx-user <
>>>>>> [email protected]> wrote:
>>>>>>
>>>>>>> And since now I encounter the same problem with my day images. And
>>>>>>> the timescale is extended into the first hours of next year. Thus I'm
>>>>>>> quite
>>>>>>> confident that my problems will disappear as soon as the next year
>>>>>>> starts.
>>>>>>>
>>>>>>> To me it looks as if the access to weewx.sdb searches at a wrong
>>>>>>> time. Sadly I can't look deeper to debug that. There are no error
>>>>>>> messages
>>>>>>> within journalctl.
>>>>>>>
>>>>>>> I'm using two sqlite DBs - the original weewx.sdb of course and a
>>>>>>> second one with forecast data. Maybe if the border of a year is crossed
>>>>>>> the
>>>>>>> weewx.sdb becomes unavailable? I can even report the time - it happens
>>>>>>> exactly at 14:00. Afterwards the timeaxis starts to go  till 3 o'clock
>>>>>>> in
>>>>>>> the night (till 14:00 it goes till midnight). And only forecast data is
>>>>>>> drawn (but containing data from today and tomorrow - no problem with
>>>>>>> year
>>>>>>> boundary). Even dayUV is no longer updated despite not using forecast
>>>>>>> data
>>>>>>> at all (but with the same timeaxis crossing the year boundary).
>>>>>>>
>>>>>>> Michael Waldor schrieb am Samstag, 30. Dezember 2023 um 10:20:05
>>>>>>> UTC+1:
>>>>>>>
>>>>>>>> Since (today?) all week images contain no measured data, only the
>>>>>>>> forecast data are visible.
>>>>>>>> [image: weektempdew.png]
>>>>>>>> I have to admit that I've patched utilities.py to shift the right
>>>>>>>> border of the timescale into the "future". It works fine all over the
>>>>>>>> year.
>>>>>>>> To my surprise all (measured) data is missing. If I drop my shift the
>>>>>>>> data
>>>>>>>> re-appears. But - as you see from the image above - the timescale
>>>>>>>> looks
>>>>>>>> fine and is exactly as intended. I've even debugged my modification
>>>>>>>> for the
>>>>>>>> current date, and everythind works as intended. But why are there no
>>>>>>>> data
>>>>>>>> from the past? Even from the above image one can see that
>>>>>>>> imagegenerator.py
>>>>>>>> can cross the year boundary perfectly.
>>>>>>>>
>>>>>>>> And there IS data available within the past (I've checked this by
>>>>>>>> dropping my change, and I've got a plot between 23. and 31.).
>>>>>>>>
>>>>>>>> Why does weewx don't see the missing data? Images without forecast
>>>>>>>> data aren't generated at all, e.g. weekUV.
>>>>>>>>
>>>>>>>> For more details on my patch see
>>>>>>>> https://groups.google.com/g/weewx-user/c/76qdbSy3bbQ/m/oIlk3sKrBgAJ
>>>>>>>>
>>>>>>>> Regards, Michael
>>>>>>>>
>>>>>>>> --
>>>>>>> You received this message because you are subscribed to the Google
>>>>>>> Groups "weewx-user" group.
>>>>>>> To unsubscribe from this group and stop receiving emails from it,
>>>>>>> send an email to [email protected].
>>>>>>> To view this discussion on the web visit
>>>>>>> https://groups.google.com/d/msgid/weewx-user/b4d802ee-c929-4ebb-aee9-e52c040a24c0n%40googlegroups.com
>>>>>>>
>>>>>>> <https://groups.google.com/d/msgid/weewx-user/b4d802ee-c929-4ebb-aee9-e52c040a24c0n%40googlegroups.com?utm_medium=email&utm_source=footer>
>>>>>>> .
>>>>>>>
>>>>>>

--
You received this message because you are subscribed to the Google Groups
"weewx-user" group.
To unsubscribe from this group and stop receiving emails from it, send an email
to [email protected].
To view this discussion on the web visit
https://groups.google.com/d/msgid/weewx-user/378e1cee-a998-4899-bd65-1f251ccfdd08n%40googlegroups.com.
###############################################################################
# SEASONS SKIN CONFIGURATION FILE #
# Copyright (c) 2018-2021 Tom Keffer <[email protected]> and Matthew Wall #
# See the file LICENSE.txt for your rights. #
###############################################################################
SKIN_NAME = Seasons_DWD
SKIN_VERSION = 4.10.2d
###############################################################################
# The following section is for any extra tags that you want to be available in
# the templates
[Extras]
# This radar image would be available as $Extras.radar_img
radar_img = https://www.dwd.de/DWD/wetter/radar/rad_baw_akt.jpg
# This URL will be used as the image hyperlink:
radar_url =
https://www.dwd.de/DE/leistungen/radarbild_film/radarbild_film.html
# This water gauge image would be available as $Extras.water_gauge_img
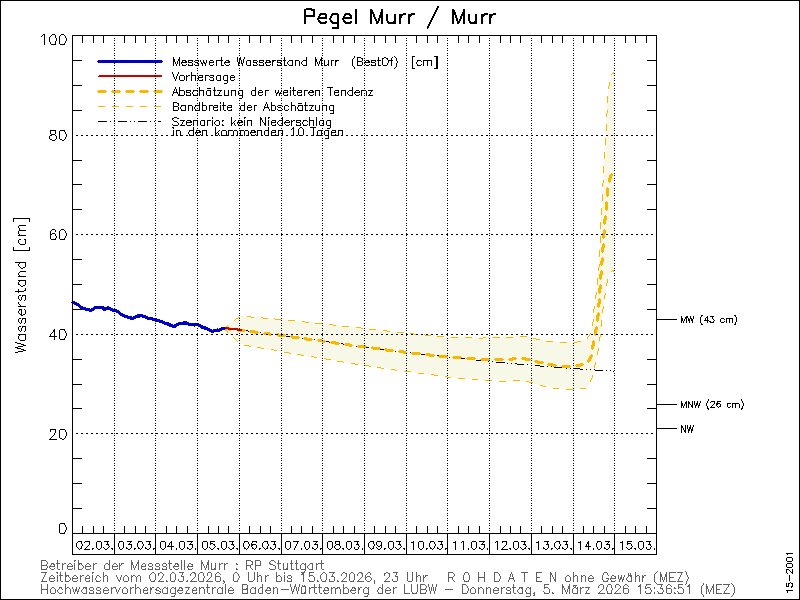
water_gauge_img = https://www.hvz.baden-wuerttemberg.de/gifs/00015-2001.GIF
# This URL will be used as the image hyperlink:
water_gauge_url = https://www.hvz.baden-wuerttemberg.de/pegel.html?id=00015
# Similar to radar, but for satellite image.
#satellite_img =
http://images.intellicast.com/WxImages/SatelliteLoop/hipacsat_None_anim.gif
#satellite_url =
http://images.intellicast.com/WxImages/SatelliteLoop/hipacsat_None_anim.gif
# To display a map, enter an API key for google maps
#google_maps_apikey = xxx
# If you have a Google Analytics ID, uncomment and edit the next line, and
# the analytics code will be included in your generated HTML files:
#googleAnalyticsId = UA-12345678-1
###############################################################################
# The following section contains variables that determine which observations
# and plots will be shown in the template files, and their order. Like other
# configuration options, these can be overridden in the weewx config file.
[DisplayOptions]
# Show link to RSS feed?
show_rss = False
# Show link to NOAA-style summary reports?
show_reports = True
# This list determines which types will appear in the "current conditions"
# section, as well as in which order.
observations_current = outTemp, heatindex, windchill, dewpoint,
outHumidity, barometer, windSpeed, rain, rainRate, UV, radiation,
lightning_strike_count, inTemp, inHumidity, extraTemp1, extraHumid1,
extraTemp2, extraHumid2, pm1_0, pm2_5, pm10_0
# This list determines which types will appear in the "statistics" and
# "statistical summary" sections, as well as in which order.
observations_stats = outTemp, heatindex, windchill, dewpoint, outHumidity,
barometer, windSpeed, rain, rainRate, ET, hail, hailRate, snow, UV, radiation,
lightning_strike_count, lightning_distance, inTemp, inHumidity, extraTemp1,
extraHumid1, extraTemp2, extraHumid2, extraTemp3, extraHumid3, extraTemp4,
extraHumid4, extraTemp5, extraHumid5, extraTemp6, extraHumid6, extraTemp7,
extraHumid7, extraTemp8, extraHumid8, leafTemp1, leafTemp2, leafWet1, leafWet2,
soilTemp1, soilTemp2, soilTemp3, soilTemp4, soilMoist1, soilMoist2, soilMoist3,
soilMoist4, pm1_0, pm2_5, pm10_0, co, co2, nh3, no2, o3, so2
# This list determines which types will appear in the RSS feed.
observations_rss = outTemp, inTemp, barometer, windSpeed, rain, rainRate,
windchill, heatindex, dewpoint, outHumidity, inHumidity
# Some observations display a sum rather than min/max values
obs_type_sum = rain, ET, hail, snow, lightning_strike_count
# Some observations display only the max value
obs_type_max = rainRate, hailRate, snowRate, UV
# The sensor status information is used in the sensor pages. These lists
# determine which database fields will be shown, as well as the order in
# which they will be displayed.
sensor_connections = rxCheckPercent, signal1, signal2, signal3, signal4,
signal5, signal6, signal7, signal8
sensor_batteries = outTempBatteryStatus, inTempBatteryStatus,
rainBatteryStatus, hailBatteryStatus, snowBatteryStatus, windBatteryStatus,
uvBatteryStatus, txBatteryStatus, batteryStatus1, batteryStatus2,
batteryStatus3, batteryStatus4, batteryStatus5, batteryStatus6, batteryStatus7,
batteryStatus8
sensor_voltages = consBatteryVoltage, heatingVoltage, supplyVoltage,
referenceVoltage
# This list determines which plots will be shown, as well as the order in
# which they will be displayed. The names refer to the plots defined in
# the ImageGenerator section, without any time span prefix. For example,
# the name 'wind' refers to 'daywind', 'weekwind', 'monthwind', and
# 'yearwind'.
plot_groups = barometer, tempdew, tempfeel, hum, wind, winddir, windvec,
rain, ET, UV, radiation, lightning, tempin, humin, tempext, humext, tempext2,
humext2, templeaf, wetleaf, tempsoil, moistsoil, pm
telemetry_plot_groups =rx, volt
# The list of time spans used within the skin
periods = day, week, month, year
###############################################################################
# The CheetahGenerator creates files from templates. This section
# specifies which files will be generated from which template.
[CheetahGenerator]
# Possible encodings include 'html_entities', 'strict_ascii',
'normalized_ascii',
# as well as those listed in
https://docs.python.org/3/library/codecs.html#standard-encodings
encoding = html_entities
[[SummaryByMonth]]
# Reports that summarize "by month"
[[[NOAA_month]]]
encoding = normalized_ascii
template = NOAA/NOAA-%Y-%m.txt.tmpl
[[SummaryByYear]]
# Reports that summarize "by year"
[[[NOAA_year]]]
encoding = normalized_ascii
template = NOAA/NOAA-%Y.txt.tmpl
[[ToDate]]
# Reports that show statistics "to date", such as day-to-date,
# week-to-date, month-to-date, etc.
[[[index]]]
template = index.html.tmpl
[[[statistics]]]
template = statistics.html.tmpl
[[[dwd_forecast]]]
template = forecast-KL.html.tmpl
[[[telemetry]]]
template = telemetry.html.tmpl
[[[tabular]]]
template = tabular.html.tmpl
[[[celestial]]]
template = celestial.html.tmpl
# Uncomment the following to generate a celestial page only once
# an hour instead of every report cycle.
# stale_age = 3600
[[[RSS]]]
template = rss.xml.tmpl
###############################################################################
# The CopyGenerator copies files from one location to another.
[CopyGenerator]
# List of files to be copied only the first time the generator runs
copy_once = seasons.css, seasons.js, favicon.ico, font/*.woff, font/*.woff2
# List of files to be copied each time the generator runs
# copy_always =
###############################################################################
# The ImageGenerator creates image plots of data.
[ImageGenerator]
# This section lists all the images to be generated, what SQL types are to
be included in them,
# along with many plotting options. There is a default for almost
everything. Nevertheless,
# values for most options are included to make it easy to see and
understand the options.
#
# Nearly all types in the wview-extended schema are included. However,
because of the
# 'skip_if_empty' option, only the plots with non-null data will be
actually produced.
#
# Fonts can be anything accepted by the Python Imaging Library (PIL), which
includes truetype
# (.ttf), or PIL's own font format (.pil). Note that "font size" is only
used with truetype
# (.ttf) fonts. For others, font size is determined by the bit-mapped size,
usually encoded in
# the file name (e.g., courB010.pil). A relative path for a font is
relative to the SKIN_ROOT.
# If a font cannot be found, then a default font will be used.
#
# Colors can be specified any of three ways:
# 1. Notation 0xBBGGRR;
# 2. Notation #RRGGBB; or
# 3. Using an English name, such as 'yellow', or 'blue'.
# So, 0xff0000, #0000ff, or 'blue' would all specify a pure blue color.
image_width = 600
image_height = 180
image_background_color = "#ffffff"
chart_background_color = "#ffffff"
chart_gridline_color = "#d0d0d0"
# Setting to 2 or more might give a sharper image with fewer jagged edges
anti_alias = 1
top_label_font_path = font/OpenSans-Bold.ttf
top_label_font_size = 14
unit_label_font_path = font/OpenSans-Bold.ttf
unit_label_font_size = 12
unit_label_font_color = "#787878"
bottom_label_font_path = font/OpenSans-Regular.ttf
bottom_label_font_size = 12
bottom_label_font_color = "#787878"
bottom_label_offset = 3
axis_label_font_path = font/OpenSans-Regular.ttf
axis_label_font_size = 10
axis_label_font_color = "#787878"
# Options for the compass rose, used for progressive vector plots
rose_label = N
rose_label_font_path = font/OpenSans-Regular.ttf
rose_label_font_size = 9
rose_label_font_color = "#222222"
# Default colors for the plot lines. These can be overridden for
# individual lines using option 'color'.
chart_line_colors = "#4282b4", "#b44242", "#42b442", "#42b4b4", "#b442b4"
# Default fill colors for bar charts. These can be overridden for
# individual bar plots using option 'fill_color'.
chart_fill_colors = "#72b2c4", "#c47272", "#72c472", "#72c4c4", "#c472c4"
# Type of line. Options are 'solid' or 'none'.
line_type = 'solid'
# Size of marker in pixels
marker_size = 8
# Type of marker. Options are 'cross', 'x', 'circle', 'box', or 'none'.
marker_type ='none'
# The following option merits an explanation. The y-axis scale used for
# plotting can be controlled using option 'yscale'. It is a 3-way tuple,
# with values (ylow, yhigh, min_interval). If set to "None", a parameter is
# set automatically, otherwise the value is used. However, in the case of
# min_interval, what is set is the *minimum* y-axis tick interval.
yscale = None, None, None
# For progressive vector plots, you can choose to rotate the vectors.
# Positive is clockwise.
# For my area, westerlies overwhelmingly predominate, so by rotating
# positive 90 degrees, the average vector will point straight up.
vector_rotate = 90
# This defines what fraction of the difference between maximum and minimum
# horizontal chart bounds is considered a gap in the samples and should not
# be plotted.
line_gap_fraction = 0.05
# This controls whether day/night bands will be shown. They only look good
# on plots wide enough to show individual days such as day and week plots.
show_daynight = true
# These control the appearance of the bands if they are shown.
# Here's a monochrome scheme:
daynight_day_color = "#fdfaff"
daynight_night_color = "#dfdfe2"
daynight_edge_color = "#e0d8d8"
# Here's an alternative, using a blue/yellow tint:
#daynight_day_color = "#fffff8"
#daynight_night_color = "#f8f8ff"
#daynight_edge_color = "#fff8f8"
# Default will be a line plot of width 1, without aggregation.
# Can get overridden at any level.
plot_type = line
width = 1
aggregate_type = none
# Do not generate a plot if it does not have any non-null data:
skip_if_empty = year
# What follows is a list of subsections, each specifying a time span, such
as a day, week,
# month, or year. There's nothing special about them or their names: it's
just a convenient way
# to group plots with a time span in common. You could add a time span
[[biweek_images]] and
# add the appropriate time length, aggregation strategy, etc., without
changing any code.
#
# Within each time span, each sub-subsection is the name of a plot to be
generated for that
# time span. The generated plot will be stored using that name, in whatever
directory was
# specified by option 'HTML_ROOT' in weewx.conf.
#
# With one final nesting (four brackets!) is the sql type of each line to
be included within
# that plot.
#
# Unless overridden, leaf nodes inherit options from their parent.
[[day_images]]
x_label_format = %H:%M
# x_interval = 21600 # 6h
bottom_label_format = %x %X
time_length = 97200 # 27 hours
# time_length = 100800 # 28 hours
time_offset = 36000 # 10 hours
[[[daybarometer]]]
[[[[barometer]]]]
[[[[forecast_barometer]]]]
data_type = barometer
data_binding = dwd_binding
label = ' '
color = blue
[[[daytempdew]]]
[[[[outTemp]]]]
[[[[dewpoint]]]]
[[[[forecast_outTemp]]]]
data_type = outTemp
data_binding = dwd_binding
label = ' '
color = blue
[[[[forecast_dewpoint]]]]
data_type = dewpoint
data_binding = dwd_binding
label = ' '
color = red
# [[[daytempdew]]]
# [[[[outTemp]]]]
# [[[[dewpoint]]]]
[[[daytempfeel]]]
[[[[windchill]]]]
[[[[heatindex]]]]
[[[[forecast_heatindex]]]]
data_type = heatindex
data_binding = dwd_binding
label = ' '
color = red
[[[[forecast_windchill]]]]
data_type = windchill
data_binding = dwd_binding
label = ' '
color = blue
[[[dayhum]]]
[[[[outHumidity]]]]
[[[[forecast_outHumidity]]]]
data_type = outHumidity
data_binding = dwd_binding
label = ' '
color = blue
[[[daytempin]]]
[[[[inTemp]]]]
[[[dayhumin]]]
[[[[inHumidity]]]]
# Plot extra temperatures. You can add more temperature sensors here.
# However, you might want to make a second plot if your system has more
# than 3 extra sensors, otherwise the plots can become rather busy.
[[[daytempext]]]
yscale = None, None, 0.5
[[[[extraTemp1]]]]
[[[[extraTemp2]]]]
[[[[extraTemp3]]]]
[[[[extraTemp4]]]]
[[[daytempext2]]]
yscale = None, None, 0.5
[[[[extraTemp5]]]]
[[[[extraTemp6]]]]
[[[[extraTemp7]]]]
[[[[extraTemp8]]]]
[[[dayhumext]]]
[[[[extraHumid1]]]]
[[[[extraHumid2]]]]
[[[[extraHumid3]]]]
[[[[extraHumid4]]]]
[[[dayhumext2]]]
[[[[extraHumid5]]]]
[[[[extraHumid6]]]]
[[[[extraHumid7]]]]
[[[[extraHumid8]]]]
[[[daytempleaf]]]
[[[[leafTemp1]]]]
[[[[leafTemp2]]]]
[[[daywetleaf]]]
[[[[leafWet1]]]]
[[[[leafWet2]]]]
[[[daytempsoil]]]
[[[[soilTemp1]]]]
[[[[soilTemp2]]]]
[[[[soilTemp3]]]]
[[[[soilTemp4]]]]
[[[daymoistsoil]]]
[[[[soilMoist1]]]]
[[[[soilMoist2]]]]
[[[[soilMoist3]]]]
[[[[soilMoist4]]]]
[[[daypm]]]
[[[[pm1_0]]]]
[[[[pm2_5]]]]
[[[[pm10_0]]]]
[[[daylightning]]]
yscale = None, None, 1
plot_type = bar
[[[[lightning_strike_count]]]]
aggregate_type = sum
aggregate_interval = hour
label = Lightning (hourly total)
[[[dayrain]]]
# Make sure the y-axis increment is at least 0.02 for the rain plot
yscale = None, None, 0.02
plot_type = bar
[[[[rain]]]]
aggregate_type = sum
aggregate_interval = hour
label = Rain (hourly total)
[[[[forecast_rain]]]]
data_type = rain
data_binding = dwd_binding
label = ' '
color = blue
fill_color = lightblue
aggregate_type = sum
aggregate_interval = hour
[[[daywind]]]
[[[[windSpeed]]]]
[[[[windGust]]]]
[[[[forecast_windSpeed]]]]
data_type = windSpeed
data_binding = dwd_binding
label = ' '
color = blue
[[[[forecast_windGust]]]]
data_type = windGust
data_binding = dwd_binding
label = ' '
color = red
[[[daywinddir]]]
# Hardwire in the y-axis scale for wind direction
yscale = 0.0, 360.0, 45.0
line_type = None
marker_type = box
marker_size = 2
[[[[windDir]]]]
[[[[forecast_windDir]]]]
data_type = windDir
data_binding = dwd_binding
label = ' '
color = blue
[[[daywindvec]]]
[[[[windvec]]]]
plot_type = vector
[[[[forecast_windvec]]]]
data_type = windvec
data_binding = dwd_binding
plot_type = vector
label = ' '
color = blue
[[[dayET]]]
# Make sure the y-axis increment is at least 0.02 for the ET plot
yscale = None, None, 0.02
plot_type = bar
[[[[ET]]]]
aggregate_type = sum
aggregate_interval = hour
label = Evapotranspiration (hourly total)
[[[dayUV]]]
# If your radiation sensor has a bounded scale, enforce that here.
# yscale = 0, 16, 1
[[[[UV]]]]
[[[dayradiation]]]
[[[[radiation]]]]
[[[dayrx]]]
yscale = 0.0, 100.0, 25.0
[[[[rxCheckPercent]]]]
[[[dayvolt]]]
[[[[consBatteryVoltage]]]]
[[[[heatingVoltage]]]]
[[[[supplyVoltage]]]]
[[[[referenceVoltage]]]]
[[week_images]]
x_label_format = %d
bottom_label_format = %x %X
time_length = 604800 # 7 days
time_offset = 259200 # 3 days
aggregate_type = avg
aggregate_interval = hour
[[[weekbarometer]]]
[[[[barometer]]]]
[[[[forecast_barometer]]]]
data_type = barometer
data_binding = dwd_binding
label = ' '
color = blue
[[[weektempdew]]]
[[[[outTemp]]]]
[[[[dewpoint]]]]
[[[[forecast_outTemp]]]]
data_type = outTemp
data_binding = dwd_binding
label = ' '
color = blue
[[[[forecast_dewpoint]]]]
data_type = dewpoint
data_binding = dwd_binding
label = ' '
color = red
[[[weektempfeel]]]
[[[[windchill]]]]
[[[[heatindex]]]]
[[[[forecast_heatindex]]]]
data_type = heatindex
data_binding = dwd_binding
label = ' '
color = red
[[[[forecast_windchill]]]]
data_type = windchill
data_binding = dwd_binding
label = ' '
color = blue
[[[weektempin]]]
[[[[inTemp]]]]
[[[weektempext]]]
yscale = None, None, 0.5
[[[[extraTemp1]]]]
[[[[extraTemp2]]]]
[[[[extraTemp3]]]]
[[[[extraTemp4]]]]
[[[weektempext2]]]
yscale = None, None, 0.5
[[[[extraTemp5]]]]
[[[[extraTemp6]]]]
[[[[extraTemp7]]]]
[[[[extraTemp8]]]]
[[[weekhum]]]
[[[[outHumidity]]]]
[[[[forecast_outHumidity]]]]
data_type = outHumidity
data_binding = dwd_binding
label = ' '
color = blue
[[[weekhumin]]]
[[[[inHumidity]]]]
[[[weekhumext]]]
[[[[extraHumid1]]]]
[[[[extraHumid2]]]]
[[[[extraHumid3]]]]
[[[[extraHumid4]]]]
[[[weekhumext2]]]
[[[[extraHumid5]]]]
[[[[extraHumid6]]]]
[[[[extraHumid7]]]]
[[[[extraHumid8]]]]
[[[weektempleaf]]]
[[[[leafTemp1]]]]
[[[[leafTemp2]]]]
[[[weekwetleaf]]]
[[[[leafWet1]]]]
[[[[leafWet2]]]]
[[[weektempsoil]]]
[[[[soilTemp1]]]]
[[[[soilTemp2]]]]
[[[[soilTemp3]]]]
[[[[soilTemp4]]]]
[[[weekmoistsoil]]]
[[[[soilMoist1]]]]
[[[[soilMoist2]]]]
[[[[soilMoist3]]]]
[[[[soilMoist4]]]]
[[[weekpm]]]
[[[[pm1_0]]]]
[[[[pm2_5]]]]
[[[[pm10_0]]]]
[[[weeklightning]]]
yscale = None, None, 1
plot_type = bar
[[[[lightning_strike_count]]]]
aggregate_type = sum
aggregate_interval = day
label = Lightning (daily total)
[[[weekrain]]]
yscale = None, None, 0.02
plot_type = bar
[[[[rain]]]]
aggregate_type = sum
aggregate_interval = day
label = Rain (daily total)
[[[[forecast_rain]]]]
data_type = rain
data_binding = dwd_binding
label = ' '
color = blue
fill_color = lightblue
aggregate_type = sum
aggregate_interval = day
[[[weekwind]]]
[[[[windSpeed]]]]
[[[[windGust]]]]
aggregate_type = max
[[[[forecast_windSpeed]]]]
data_type = windSpeed
data_binding = dwd_binding
label = ' '
color = blue
[[[[forecast_windGust]]]]
data_type = windGust
data_binding = dwd_binding
aggregate_type = max
label = ' '
color = red
[[[weekwinddir]]]
yscale = 0.0, 360.0, 45.0
line_type = None
marker_type = box
marker_size = 2
[[[[windDir]]]]
[[[[forecast_windDir]]]]
data_type = windDir
data_binding = dwd_binding
label = ' '
color = blue
[[[weekwindvec]]]
[[[[windvec]]]]
plot_type = vector
[[[[forecast_windvec]]]]
data_type = windvec
data_binding = dwd_binding
plot_type = vector
label = ' '
color = blue
[[[weekET]]]
yscale = None, None, 0.02
plot_type = bar
[[[[ET]]]]
aggregate_type = sum
aggregate_interval = day
label = Evapotranspiration (daily total)
[[[weekUV]]]
# yscale = 0, 16, 1
[[[[UV]]]]
[[[weekradiation]]]
[[[[radiation]]]]
[[[weekrx]]]
yscale = 0.0, 100.0, 25.0
[[[[rxCheckPercent]]]]
[[[weekvolt]]]
[[[[consBatteryVoltage]]]]
[[[[heatingVoltage]]]]
[[[[supplyVoltage]]]]
[[[[referenceVoltage]]]]
[[month_images]]
x_label_format = %d
bottom_label_format = %x %X
time_length = 2592000 # 30 days
aggregate_type = avg
aggregate_interval = 10800 # 3 hours
show_daynight = false
[[[monthbarometer]]]
[[[[barometer]]]]
[[[monthtempdew]]]
[[[[outTemp]]]]
[[[[dewpoint]]]]
[[[monthtempfeel]]]
[[[[windchill]]]]
[[[[heatindex]]]]
[[[monthtempin]]]
[[[[inTemp]]]]
[[[monthtempext]]]
yscale = None, None, 0.5
[[[[extraTemp1]]]]
[[[[extraTemp2]]]]
[[[[extraTemp3]]]]
[[[[extraTemp4]]]]
[[[monthtempext2]]]
yscale = None, None, 0.5
[[[[extraTemp5]]]]
[[[[extraTemp6]]]]
[[[[extraTemp7]]]]
[[[[extraTemp8]]]]
[[[monthhum]]]
[[[[outHumidity]]]]
[[[monthhumin]]]
[[[[inHumidity]]]]
[[[monthhumext]]]
[[[[extraHumid1]]]]
[[[[extraHumid2]]]]
[[[[extraHumid3]]]]
[[[[extraHumid4]]]]
[[[monthhumext2]]]
[[[[extraHumid5]]]]
[[[[extraHumid6]]]]
[[[[extraHumid7]]]]
[[[[extraHumid8]]]]
[[[monthtempleaf]]]
[[[[leafTemp1]]]]
[[[[leafTemp2]]]]
[[[monthwetleaf]]]
[[[[leafWet1]]]]
[[[[leafWet2]]]]
[[[monthtempsoil]]]
[[[[soilTemp1]]]]
[[[[soilTemp2]]]]
[[[[soilTemp3]]]]
[[[[soilTemp4]]]]
[[[monthmoistsoil]]]
[[[[soilMoist1]]]]
[[[[soilMoist2]]]]
[[[[soilMoist3]]]]
[[[[soilMoist4]]]]
[[[monthpm]]]
[[[[pm1_0]]]]
[[[[pm2_5]]]]
[[[[pm10_0]]]]
[[[monthlightning]]]
yscale = None, None, 1
plot_type = bar
[[[[lightning_strike_count]]]]
aggregate_type = sum
aggregate_interval = day
label = Lightning (daily total)
[[[monthrain]]]
yscale = None, None, 0.02
plot_type = bar
[[[[rain]]]]
aggregate_type = sum
aggregate_interval = day
label = Rain (daily total)
[[[monthwind]]]
[[[[windSpeed]]]]
[[[[windGust]]]]
aggregate_type = max
[[[monthwinddir]]]
yscale = 0.0, 360.0, 45.0
line_type = None
marker_type = box
marker_size = 2
[[[[windDir]]]]
[[[monthwindvec]]]
[[[[windvec]]]]
plot_type = vector
[[[monthET]]]
yscale = None, None, 0.02
plot_type = bar
[[[[ET]]]]
aggregate_type = sum
aggregate_interval = day
label = Evapotranspiration (daily total)
[[[monthUV]]]
# yscale = 0, 16, 1
[[[[UV]]]]
[[[monthradiation]]]
[[[[radiation]]]]
[[[monthrx]]]
yscale = 0.0, 100.0, 25.0
[[[[rxCheckPercent]]]]
[[[monthvolt]]]
[[[[consBatteryVoltage]]]]
[[[[heatingVoltage]]]]
[[[[supplyVoltage]]]]
[[[[referenceVoltage]]]]
[[year_images]]
x_label_format = %m
bottom_label_format = %x %X
time_length = 31536000 # 365 days
aggregate_type = avg
aggregate_interval = day
show_daynight = false
[[[yearbarometer]]]
[[[[barometer]]]]
[[[yeartempdew]]]
[[[[outTemp]]]]
[[[[dewpoint]]]]
[[[yeartempfeel]]]
[[[[windchill]]]]
[[[[heatindex]]]]
[[[yeartempin]]]
[[[[inTemp]]]]
[[[yeartempext]]]
yscale = None, None, 0.5
[[[[extraTemp1]]]]
[[[[extraTemp2]]]]
[[[[extraTemp3]]]]
[[[[extraTemp4]]]]
[[[yeartempext2]]]
yscale = None, None, 0.5
[[[[extraTemp5]]]]
[[[[extraTemp6]]]]
[[[[extraTemp7]]]]
[[[[extraTemp8]]]]
[[[yearhum]]]
[[[[outHumidity]]]]
[[[yearhumin]]]
[[[[inHumidity]]]]
[[[yearhumext]]]
[[[[extraHumid1]]]]
[[[[extraHumid2]]]]
[[[[extraHumid3]]]]
[[[[extraHumid4]]]]
[[[yearhumext2]]]
[[[[extraHumid5]]]]
[[[[extraHumid6]]]]
[[[[extraHumid7]]]]
[[[[extraHumid8]]]]
[[[yeartempleaf]]]
[[[[leafTemp1]]]]
[[[[leafTemp2]]]]
[[[yearwetleaf]]]
[[[[leafWet1]]]]
[[[[leafWet2]]]]
[[[yeartempsoil]]]
[[[[soilTemp1]]]]
[[[[soilTemp2]]]]
[[[[soilTemp3]]]]
[[[[soilTemp4]]]]
[[[yearmoistsoil]]]
[[[[soilMoist1]]]]
[[[[soilMoist2]]]]
[[[[soilMoist3]]]]
[[[[soilMoist4]]]]
[[[yearpm]]]
[[[[pm1_0]]]]
[[[[pm2_5]]]]
[[[[pm10_0]]]]
[[[yearlightning]]]
yscale = None, None, 1
plot_type = bar
[[[[lightning_strike_count]]]]
aggregate_type = sum
aggregate_interval = week
label = Lightning (weekly total)
[[[yearrain]]]
yscale = None, None, 0.02
plot_type = bar
[[[[rain]]]]
aggregate_type = sum
aggregate_interval = week
label = Rain (weekly total)
[[[yearwind]]]
[[[[windSpeed]]]]
[[[[windGust]]]]
aggregate_type = max
[[[yearwinddir]]]
yscale = 0.0, 360.0, 45.0
line_type = None
marker_type = box
marker_size = 2
[[[[windDir]]]]
[[[yearwindvec]]]
[[[[windvec]]]]
plot_type = vector
[[[yearET]]]
yscale = None, None, 0.02
plot_type = bar
[[[[ET]]]]
aggregate_type = sum
aggregate_interval = week
label = Evapotranspiration (weekly total)
[[[yearUV]]]
# yscale = 0, 16, 1
[[[[UV]]]]
[[[yearradiation]]]
[[[[radiation]]]]
[[[yearrx]]]
yscale = 0.0, 100.0, 25.0
[[[[rxCheckPercent]]]]
[[[yearvolt]]]
[[[[consBatteryVoltage]]]]
[[[[heatingVoltage]]]]
[[[[supplyVoltage]]]]
[[[[referenceVoltage]]]]
# This is how to generate a plot of high/low temperatures for the year:
# [[[yearhilow]]]
# [[[[hi]]]]
# data_type = outTemp
# aggregate_type = max
# label = High
# [[[[low]]]]
# data_type = outTemp
# aggregate_type = min
# label = Low Temperature
###############################################################################
[Generators]
# The list of generators that are to be run:
generator_list = weewx.cheetahgenerator.CheetahGenerator,
weewx.imagegenerator.ImageGenerator, weewx.reportengine.CopyGenerator