Hi All,

I've been working with several templates on file system utilization,
temperature & humidity, bgp peers, and one thing that they all have in
common is following trends pretty closely.  I've looked through RRD's
documentation and I have been able to draw trend lines on the graphs
with no difficulty (which is great!)..... but here comes the
question/problem.   Trend lines are great, however if the trend line
stops at the point that graph is drawn (ie "now") the trend doesn't
provide any sort of helpful information.
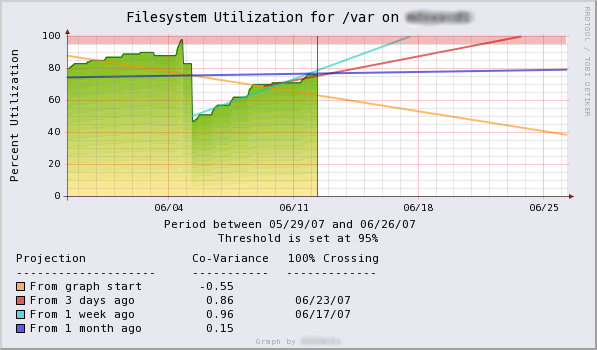
What would rock would be able to draw trends and information in a
similar format to:
http://oss.oetiker.ch/rrdtool/gallery/fsu_predict.png  but to do this,
the graph has to display into the future (i assume a "--end now+2w")
and then the appropriate trend line information.

I've tried putting "--end now+2w" into the custom definition, however
renderserver complains about and unknown option.  So i tried
"--end=now+2w"  which it doesn't complain any more, but it also
doesn't graph into the future.....

If anybody has attempted this, or has examples, or even just a
resource of information that I may have missed with my googling,
please let me know.

Thanks!

-Trey
_______________________________________________
zenoss-users mailing list
[email protected]
http://lists.zenoss.org/mailman/listinfo/zenoss-users