On Fri, Jun 10, 2011 at 6:00 PM, Steven McCoy <[email protected]> wrote:
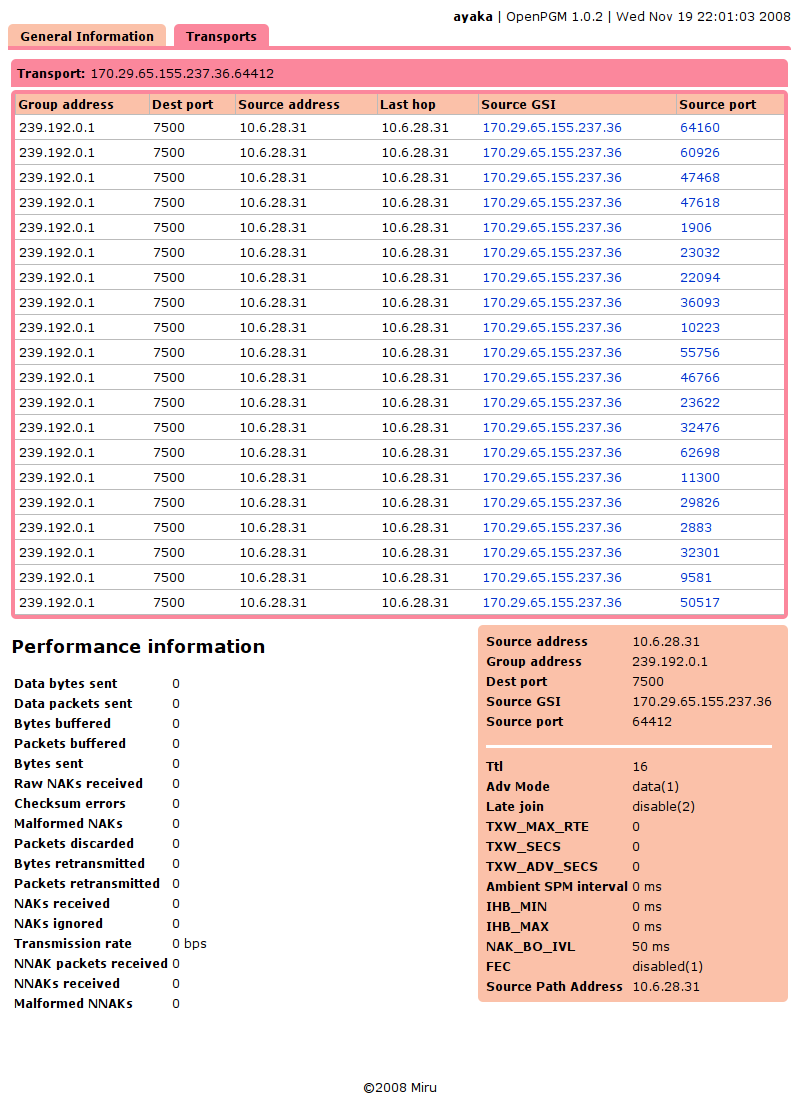
> On 10 June 2011 16:10, Ladan Gharai <[email protected]> wrote:
>
>>
>> But it seems even more of our loss problems were related to having set
>>> ZMQ_RATE to a rather high number (initially 950Mbps and then 500Mbps) - I
>>> have now reduced it to 100Mbps. I am now seeing the following behaviors:
>>>
>>
>>
>>    1. If I do send 100Mbps the receiver actually sees ~90Mbps. Is  10%
>>    the % allocated for  SPM/SPMR/RDATA/....?
>>
>>
> It is configurable, but by default in 0MQ now the data rate is for original
> data only, other packet types, i.e. repairs are not included.
>
>
>>
>>    1. If I send 100 or say 90 Mbps CPU usage goes up to 100%! and with
>>    50Mbps it is around 50% ... is this normal?
>>
>>
Hi Steve-o:

Sorry, I wasn't clear in my email - the high CPU usage is on the *send*
side.

But the good news is with nak_data_retries = 2,nak_ncf_retries=2 and
ZMQ_RATE=200Mbps and an actual send-rate around 100Mbps  - I've had a pretty
steady flow running for over a day now (sending and receiving at 100Mbps).
>
>
For these data rates the CPU usage for the sender is at 56% and the receiver
is at 30% - are these numbers normal for ePGM?


Ladan


>>
>> It is indicating some form of data loss or severe packet re-ordering.
>  When the receiver state engine is engaged high resolution timers are used
> to migrate between different states, the side effects of high resolution
> timers may be bogus CPU time reporting.  Also, on Windows it has been shown
> that using a strict rate limiter does significantly improve overall system
> performance.
>
> However also of note that pushing 0MQ + PGM at full speed is not always
> recommended as if your application is feeding 0MQ faster than PGM is
> draining you are going to have a massive memory drain and message churn
> inside 0MQ.  The solution is to implement a coarse grained limiter inside
> your own application, you don't want a fine grain limiter as they are quite
> expensive to run.
>
> It is certainly worth further investigation, from the hardware and through
> the operating system and the PGM protocol timings.  Try running Wireshark
> and compare the levels of ODATA, RDATA, and NAK packet usage.  If you are
> feeling adventurous you can extend 0MQ with coverage of the statistics
> available inside OpenPGM, they've been there since version 1.0:
>
> http://miru.hk/wiki/PGMHTTP_-_receive_transport.png
>
>
>>
>>    1.
>>       - this does not seem to happen with the ZMQ ipc or tcp sockets -
>>       but then those transports are not effected by ZMQ_RATE either
>>
>>
> Correct, only PGM.  The implementation is to help reduce problems with
> handling data loss when transmitting a saturating payload.
>
> --
> Steve-o
>
> _______________________________________________
> zeromq-dev mailing list
> [email protected]
> http://lists.zeromq.org/mailman/listinfo/zeromq-dev
>
>
_______________________________________________
zeromq-dev mailing list
[email protected]
http://lists.zeromq.org/mailman/listinfo/zeromq-dev