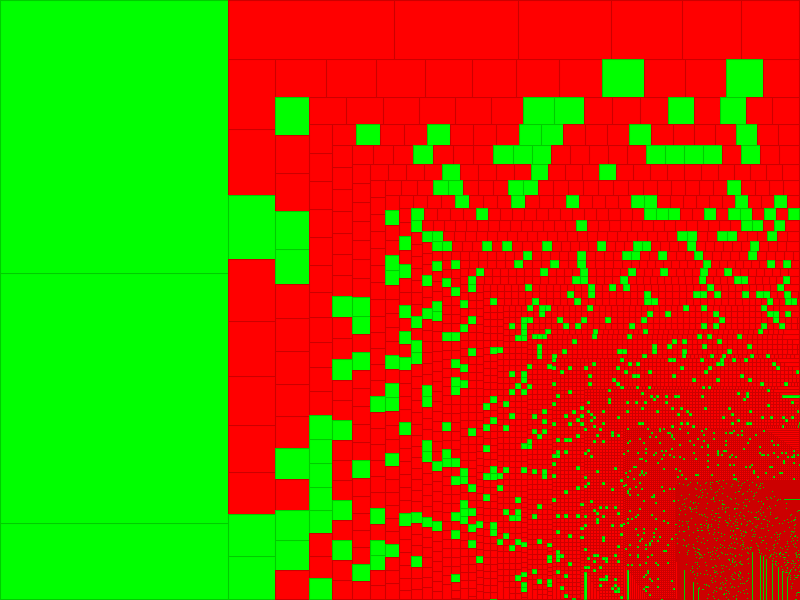
The license working group has published a graphic showing the amount of data
that is currently relicensable under CT and ODbL.
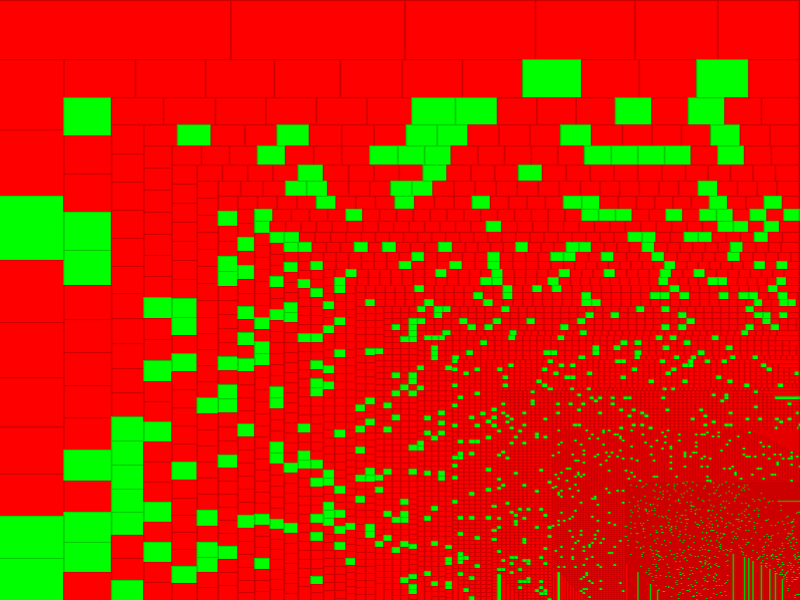
Green squares are ODbL, red squares are CC-BY-SA.  As I understand it each
square represents the square root of the size of each user's contribution.
I don't know how the contribution size is calculated, I'd guess it's just a
count of the number of nodes that were last touched by a user, which would
oversell the amount of data that would really be usable under ODbL.

Here's what the LWG published:
http://i53.photobucket.com/albums/g51/80n80n/osm/odbl.png

But that includes bulk imports and bots, so what happens if you removed
those?  Here's the same graphic with just the three largest contributors
removed (two of which are probably TIGER and AND):
http://i53.photobucket.com/albums/g51/80n80n/osm/odbl_cropped.png

That's quite a difference.  Only six of the top 30 contributors have agreed
to ODbL so far and the image is predominantly red.

By way of a rather toung-in-cheek contrast I thought I'd prepare my own
graphic showing how many OSM contributors have now agreed to CC-BY-SA.  In
this graphic the green boxes are those who have agreed and the red boxes are
those who have not:
http://i53.photobucket.com/albums/g51/80n80n/osm/cc-by-sa.png

Enjoy.
80n
_______________________________________________
legal-talk mailing list
legal-talk@openstreetmap.org
http://lists.openstreetmap.org/listinfo/legal-talk