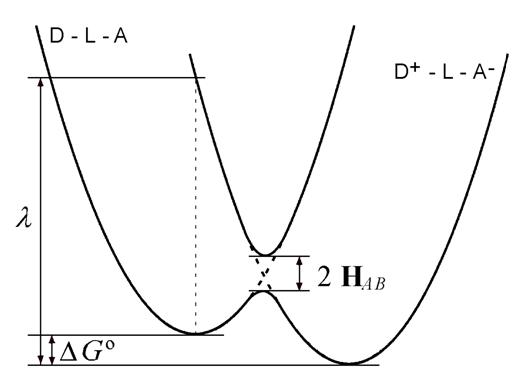
Hi all
I want to draw an two headed arrow between two points.
But I get a line. What I am doing wrong? I actually try to plot an
image similar to this one:
http://upload.wikimedia.org/wikipedia/commons/a/a3/Parameters_of_the_Marcus_Equation.JPG
may be I can use an annotate function for this.
Thanks for help.
Petro.
########
import pylab
from scipy import optimize
import numpy
x1=numpy.arange(-4000,1000,0.1)
x2=numpy.arange(-1000,4000,0.1)
y1=100*numpy.square(x1+1500)
y2=100*numpy.square(x2-1500)-0.1e9
pylab.figure()
pylab.plot(x1,y1,x2,y2)
pylab.grid("True")
pylab.arrow(-3000,0,0,-100000000,width=1)
pylab.xlim(-5000,5000)
pylab.ylim(-2e8,7e8)
pylab.show()
###########x
------------------------------------------------------------------------------
All the data continuously generated in your IT infrastructure contains a
definitive record of customers, application performance, security
threats, fraudulent activity and more. Splunk takes this data and makes
sense of it. Business sense. IT sense. Common sense.
http://p.sf.net/sfu/splunk-d2d-oct
_______________________________________________
Matplotlib-users mailing list
[email protected]
https://lists.sourceforge.net/lists/listinfo/matplotlib-users