This is what finally worked for me for setting up the plot with the
legend how I wanted:
(result is in attached PDF)

Perhaps some of you will find it useful for your own work...

#Zeileis et al.'s function for drawing palettes
pal <- function(col, border = "light gray", ...)
{
  n <- length(col)
  plot(0, 0, type="n", xlim = c(0, 1), ylim = c(0, 1), axes = FALSE,
xlab = "", ylab = "", ...)
  rect(0:(n-1)/n, 0, 1:n/n, 1, col = col, border = border)
}


library(phytools)
library(colorspace)

setwd("C:/EXTRACT_LEAF_TRAITS/TRAITVAR_RESULTS/")

MYTREE = read.nexus("s4970_t500_1.nex")
MYDATA = read.csv("s4970_t500_1.csv")

MYCOLRANGE = read.table("colorrange2.txt",header=F,sep="\t")
MCRD = dim(MYCOLRANGE)
#PAL = diverge_hcl(MCRD[1],h=c(246,40),c=96)
#PAL = heat_hcl(MCRD[1],c=c(80,30),l=c(30,90),power=c(1/5,1.5))

#PAL = heat.colors(MCRD[1])
PAL = rainbow(MCRD[1])

MYCOLRANGE[,3] = PAL #to coerce palette values to character instead of factor

tips = getExtinct(MYTREE,tol=0.01)
neo_tree = drop.tip(MYTREE,tips)

EXT_TIP_TRAITS = MYDATA[which(MYDATA[,3]==T),]
TIPLABCOLS = vector(mode="character",length=dim(EXT_TIP_TRAITS)[1])

for (i in 1:length(neo_tree$tip.label))
{
  CurrTVal = EXT_TIP_TRAITS[i,2]
  #message(CurrTVal)
  for (j in 1:dim(MYCOLRANGE)[1]){
    #message(MYCOLRANGE[j,1])
    #message(MYCOLRANGE[j,2])
    #message(MYCOLRANGE[j,3])
    if ((CurrTVal >= MYCOLRANGE[j,1]) && (CurrTVal <= MYCOLRANGE[j,2])){
      #message(MYCOLRANGE[j,3])
      TIPLABCOLS[i] = MYCOLRANGE[j,3]
      break
    }
  }
}

BINVALCHRVEC = vector(mode="character")

for (n in 1:dim(MYCOLRANGE)[1]) {

  BINVALCHR = paste(as.character(MYCOLRANGE[n,1])," - ",
as.character(MYCOLRANGE[n,2]),sep="")
  BINVALCHRVEC = c(BINVALCHRVEC,BINVALCHR)

}

colours = MYCOLRANGE[,3]


dev.off()
layout(rbind(1,2), heights=c(5.5,2.5))
layout.show(n=2)

par(mar=c(1, 0.25, 1, 0.25))
plot.phylo(neo_tree,type="phylogram",root.edge=TRUE, no.margin=FALSE,
show.tip.label=FALSE)
tiplabels(pch=22, col=TIPLABCOLS, bg=TIPLABCOLS, cex=0.3)

par(mar=c(0, 0, 0, 0))
# c(bottom, left, top, right)
plot.new()

legend("left", "groups", bty='n', legend=BINVALCHRVEC, ncol=6,
col=MYCOLRANGE[,3], bg = MYCOLRANGE[,3], pch =
rep(15,length(MYCOLRANGE[1:3])), cex=0.59)


cheers,

Gabe

On 10/28/16, Gabriel Yedid <gyedi...@gmail.com> wrote:
Hello all,
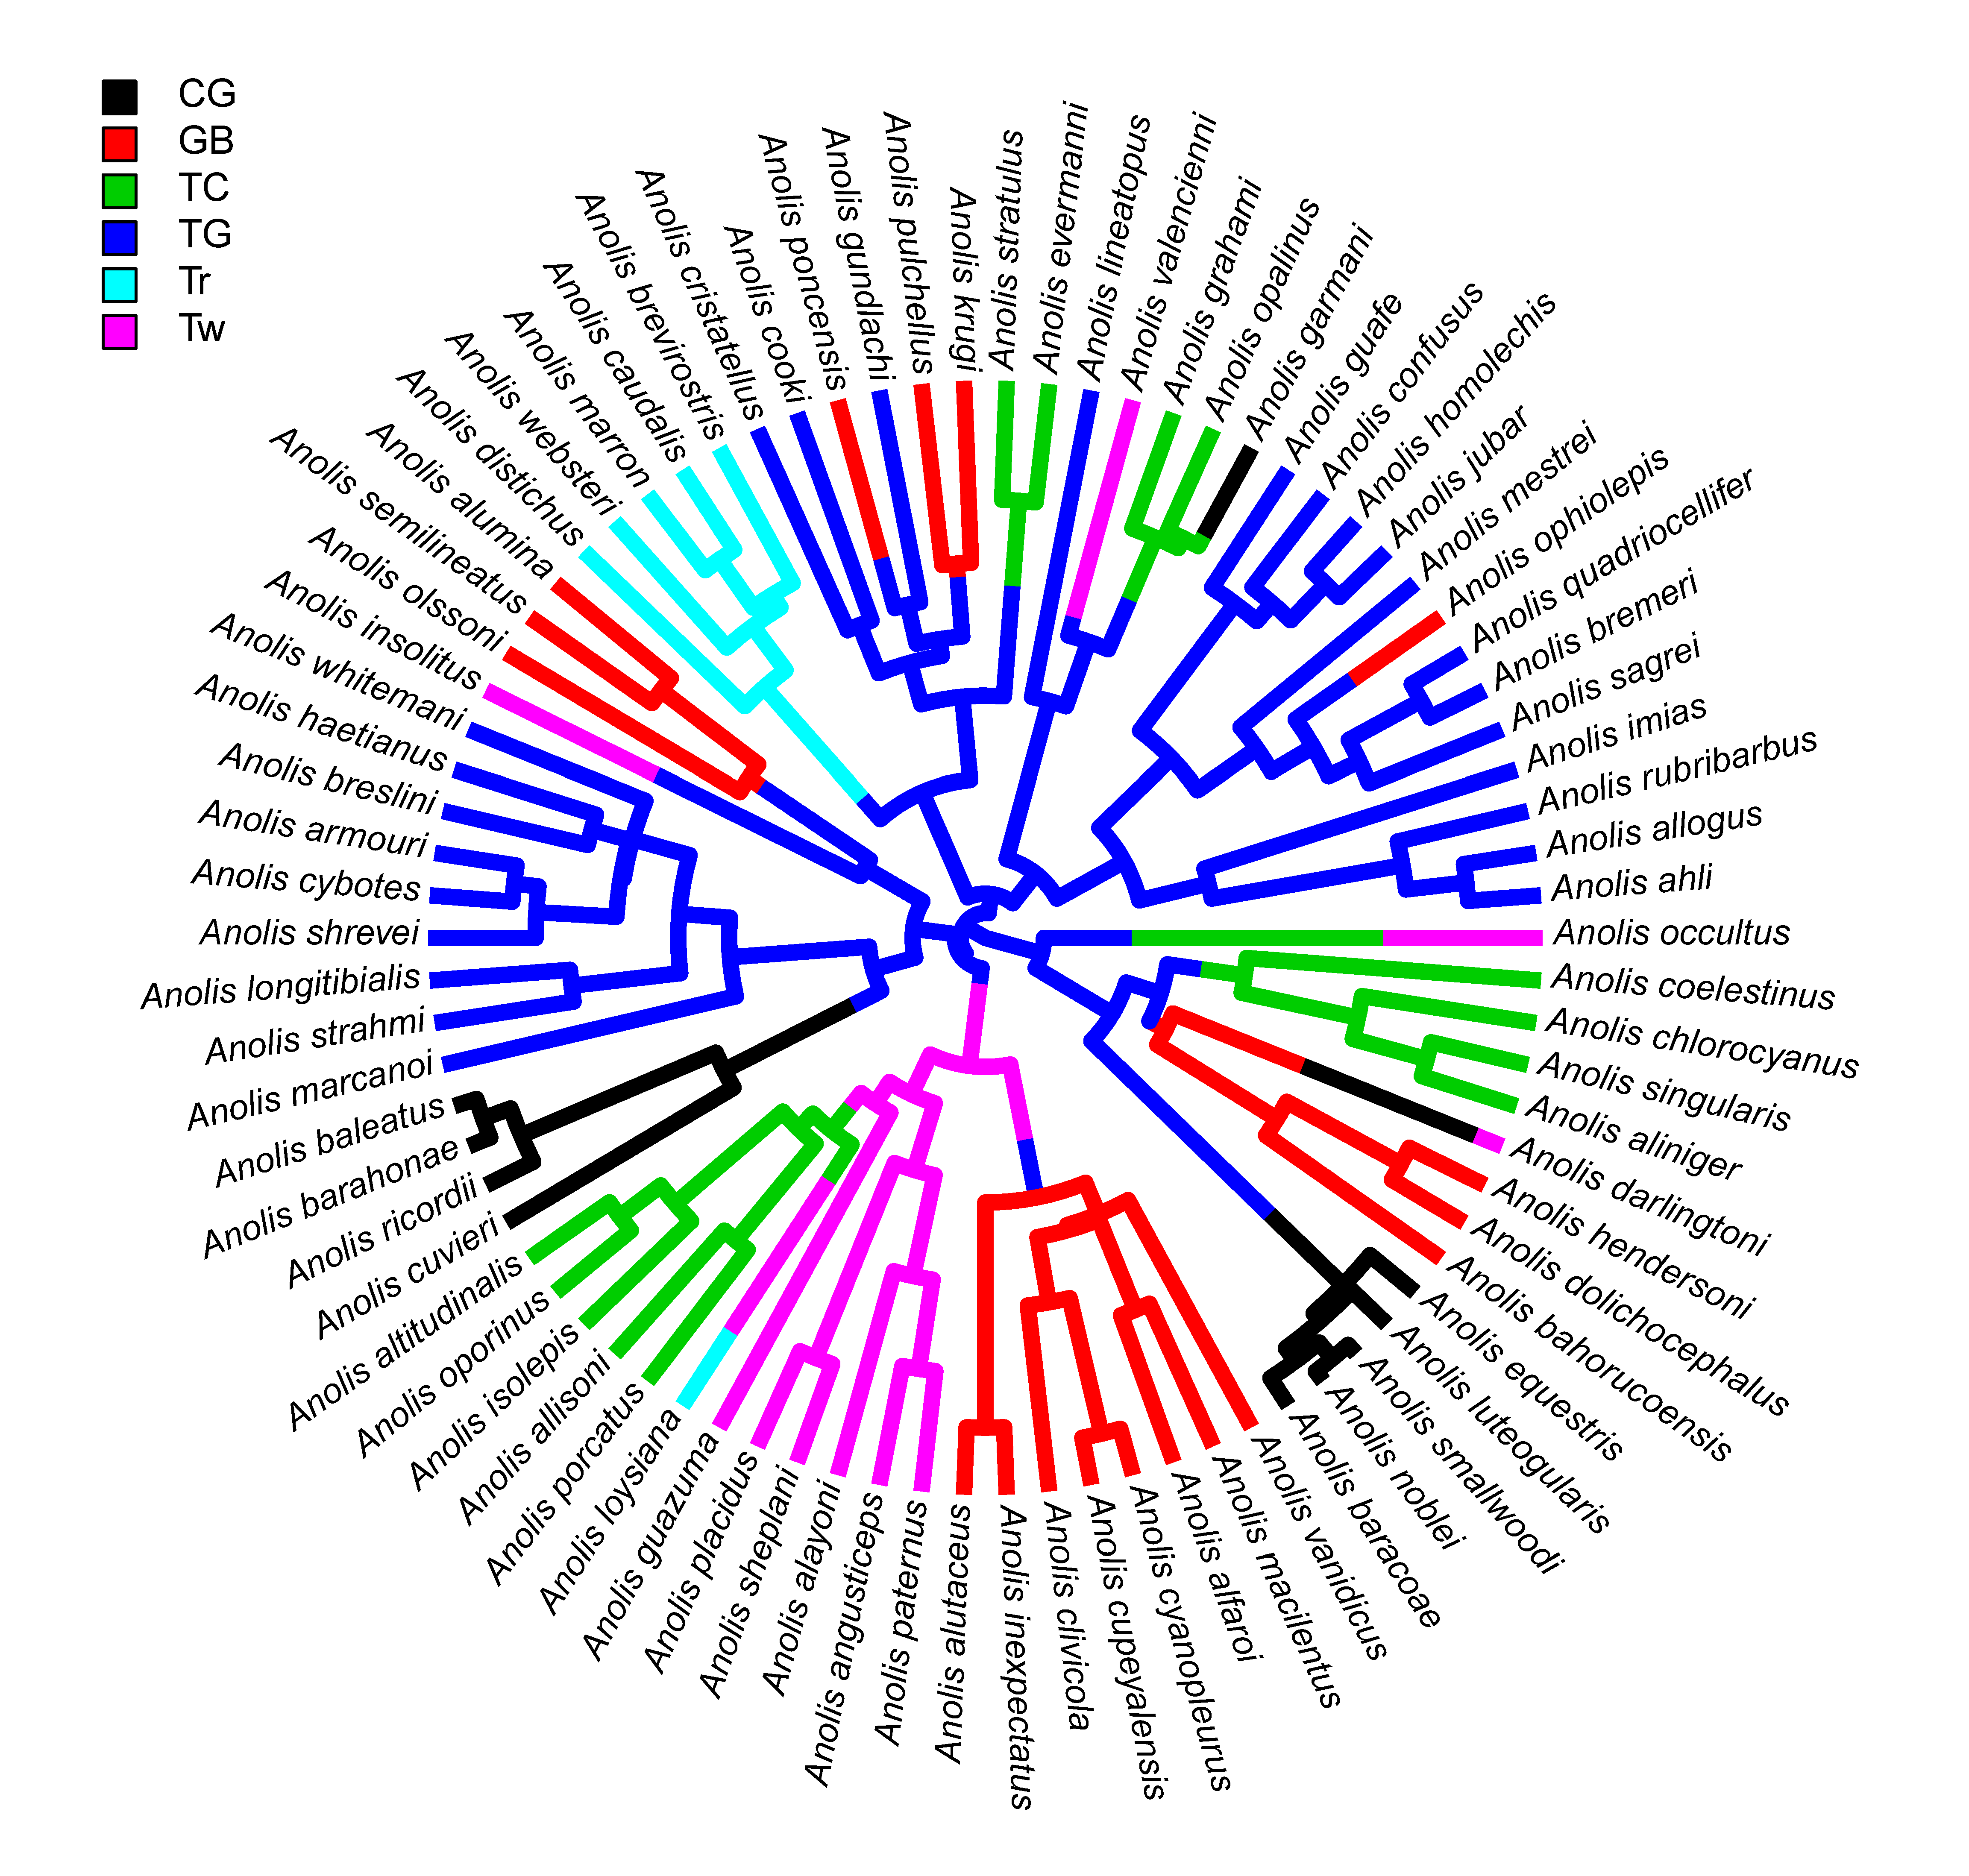
I have a phylo plot where each tip of the tree has a certain trait
value associated with it. The trait is represented by a
continuously-valued number bounded by x and y (2.0 and 15.0 for these
purposes). In order to make display tractable, the values are binned,
with each bin being assigned one colour from a sequential palette.
I have been able to display the tree as I want, with each tip getting
a single coloured square that represents its trait value (within the
bin range), but now I want to create a custom legend and put it below
the phylo plot. I know how to divide the plot window to position the
legend there, but not how to assemble and display the legend itself.
What I want is to have a coloured square representing the bin, with
text showing the bin's lower and upper limits to the right of the
square,
[ ] bin_a_lower - bin_a_upper [ ] bin_d_lower - bin_d_upper
[ ] bin_b_lower - bin_b_upper [ ] bin_e_lower - bin_e_upper
[ ] bin_c_lower - bin_c_upper <etc.>
Each of the [ ] would get a different colour specified by the hex
codes in the palette's character vector.
Does anybody know how to put the legend together from elements that
would already be in the workspace? (the palette vector, the bin limit
values, etc.) Is there a way to do it with the default legend()
function that I just don't know, or does it have to be assembled
piece-by-piece?
Alternatively, how would I get a colourbar to display in that same
space below the plotted tree?
cheers,
Gabe
_______________________________________________
R-sig-phylo mailing list - R-sig-phylo@r-project.org
https://stat.ethz.ch/mailman/listinfo/r-sig-phylo
Searchable archive at http://www.mail-archive.com/r-sig-phylo@r-project.org/