A simple way to measure the line frequency (up to a given precision...)
is to watch on a waterfall program to one of its harmonics.
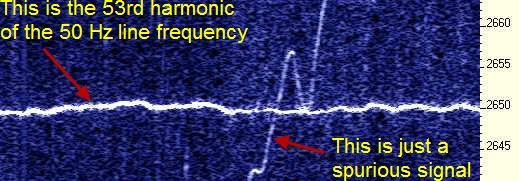
In the following picture you can see the 53rd harmonic of the 50 Hz line
frequency in Italy. It was captured by just connecting a random length
of wire to the line input of a sound card, thus capturing the ambient hum.

More sophisticated ways can be used, of course....  :-)

http://www.sdradio.eu/images/53x50hzita.jpg

73  Alberto  I2PHD
Alberto,

That's a cute plot. I see 53 x 50 = 2650. What is the x axis scale?

But I'm curious -- the pending issue with 60 Hz in the US is more about
uncorrected long-term accumulated time drift and less about short-term
frequency stability.

So it seems like you would have to integrate all the wiggles in the 53rd
harmonic of your waterfall plot in order to compute time drift, yes?

Is there any chance you could run both the waterfall frequency monitor
and also a 50 Hz phase comparator for a couple of days to see how
well (or how poorly) one can compute the net long-term mains time drift
from a set of independent short-term frequency deviation measurements?

Thanks,
/tvb


_______________________________________________
time-nuts mailing list -- time-nuts@febo.com
To unsubscribe, go to https://www.febo.com/cgi-bin/mailman/listinfo/time-nuts
and follow the instructions there.