I was concerned about the high temperatures being seen in the E-cat which were
not plausible without elevated pressure.  I remembered seeing an account on the
web (can't recall where at the moment) where there was mention of a visible
spring used in a pressure limiter (think of a pressure cooker pot).  I
extrapolated that information to a pressure limiter installed at the output
causing about 1 bar differential.

Also, Mats Lewan told me of a leak of 2 kg/h and Rossi in the video refers to a
gasket problem.  This implies a leak at the top seal, with the leak not
beginning until it was full, and probably not until it pressurized.  If it
leaked even at no differential pressure - that would be a gross leak and I
don't think such a gross leak is plausible.

I don't believe the T2 thermocouple was touching the fins.  And, I don't think
the fins were at a temperature of more than a few tenths of a degree over that
of the water - they are too thin.
Regards,  Bob Higgins
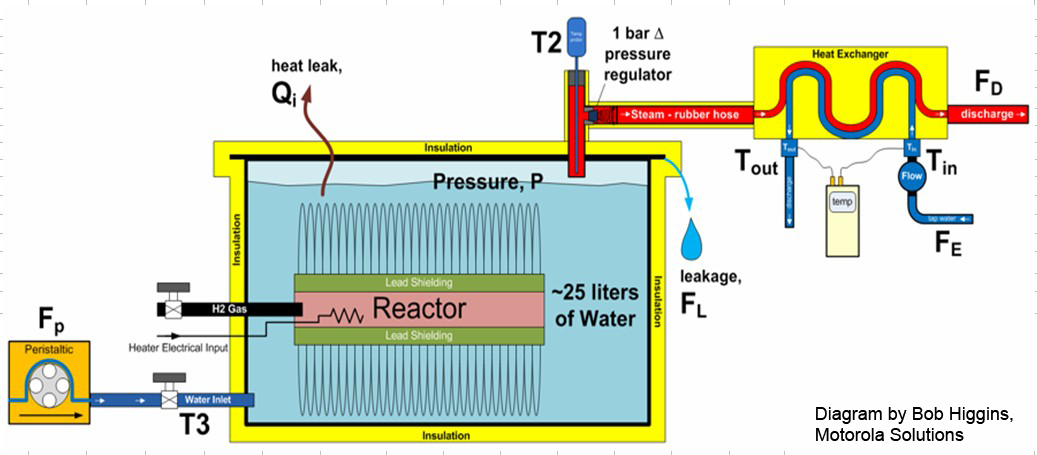
________________________________

From: Robert Lynn [mailto:robert.gulliver.l...@gmail.com]
Sent: Thursday, October 13, 2011 4:03 PM
To: vortex-l@eskimo.com
Subject: Re: [Vo]:Analysis by Bob Higgins

Obviously a lot of effort went into this.  I am curious, where did the
information about the 1 bar pressure regulator in the outlet come from?  How
does that talley with the 124°C temperature that was recorded at 15:58, given
that 124°C implies a pressure (saturated steam) of 2.25bar absoulute (1.25bar
guage)
On 13 October 2011 18:25, Alan J Fletcher <a...@well.com> wrote:
Bob Higgins of Motorola Solutions did an analysis which he sent to Mats Lewans,
who copied it to me and a couple of others on Vortex.

Hello Mr. Lewan,

I am enclosing my spreadsheet analysis of the data you published for Ing.
Rossi's October 6 test at U. of Bologna of his E-cat.  In this analysis, I
tried to incorporate reported items such as water leakage, heat loss through
the insulation, difference in source water temperature and the water
temperature of Tin, and the final energy stored in the E-cat when the
experiment was terminated.  If you have the occasion to look through this
analysis, I would appreciate hearing of anything you find that may not be
consistent with your observation as a first hand witness to the test.  You are
welcome to share this with others that may also be able to evaluate the
analysis for missing features or wrong calculations.

We considered the possibility of contamination of the Tout by the hot
water/steam of the heat exchanger primary input.  However, because the
secondary water was flowing up out of the secondary outlet and out of the brass
header, and the contamination primary heat would have to pass this water to
reach the thermocouple, and because the flow rate was high in the secondary,
heat from the primary inlet would quickly be diverted into the secondary outlet
water.  Thus, very little of this contamination heat would make it to the
thermocouple and cause temperature error - we regarded it as a possible minor
second order error.  If you draw a cross-section picture of this pipe and the
flowing water, you can see how possible contamination heat from the primary
inlet would likely terminate in the secondary outlet water long before reaching
the thermocouple.

I would agree with everyone else that there was much that could have been
improved the experiment, but the real point now it to understand the data we
have and determine what information that can be derived from it with confidence.

It is interesting now how the skeptical criticism on the net seems to be
switching from "doesn't work at all" to "doesn't work with acceptable
commercial COP".  Are the skeptics now convinced there was large scale excess
energy?  In and of itself, this is a physics shattering breakthrough.  It is
clear from the data that the COP would have been much higher if the test had
been run for a longer period.  I am personally excited by the results and data
from the experiment.

Thanks to Ing. Rossi for hosting the experiment - he was under obligation to no
one to do the experiment - and to you for reporting the data.

Regards,
Bob Higgins
Motorola Solutions

I suggested he subscribe to vortex, but meanwhile ...

He sent a very large spreadsheet, with a couple of interesting diagrams / plots.

I've put some of them (with permission) in my initial draft report
http://lenr.qumbu.com/rossi_ecat_oct11_a.php

I extracted and annotated a couple of pictures from his spreadsheet :

a) a very nice schematic diagram of the fat-cat.
http://lenr.qumbu.com/111010_pics/111012_bh_plots0002.png
(He shows a pressure regulator at the outlet ... I don't know if this is a
guess or new information!)

b) Another data plot and comments
http://lenr.qumbu.com/111010_pics/111012_bh_plots0001.png

Initially, heat is stored in the E-cat as it is filled with water and the water
is being heated.  This energy is accounted a lumped addition at the end.
When E-cat fills at about 173 min into the experiment, steam is not yet formed
and liquid spills into heat exchanger and there is measurable
heat exchanger output.  Some of the stored energy in E-cat is being quickly
lost into the heat exchanger as the liquid water carries out heat
quickly.  This causes the spike seen just after 173 min.
At 185 minutes, steam begins to form (crosses 100C) and by 200 minutes the
steam is 110C which corresponds to about .6 bar pressure (AJF : over
atmospheric -- 1.6 total).
At 220 minutes, the steam reaches about 120C which is about 1 bar of pressure
(over ambient) and the output is probably mostly steam.
At 350 minutes, the steam is down to about 116C which may make it oscillate in
the pressure valve:  valve closes, pressure builds up,
valve opens and outputs a burst of steam, valve closes.  The data is too coarse
to show this possible temperature/pressure oscillation.
The oscillation probably gets averaged out in the heat exchanger heat
measurement.  Probably needs and output measurement that
also integrates all of the heat output in one big lump as a check.
If oscillation occurs due to a pressurization valve, it could cause the
temperature measurement in the reactor (green curve above) to be
wrong.  There could be intermittent measurements of steam and water and the
steam temperature could be oscillating.

c) Overall energy balance
Test of Rossi 27kW Reactor No 2  (1 of 3 reactor cells activated)
Date: 6-Oct-11
Location: University of Bologna, Italy
Analysis: Bob Higgins
Note:  See supplemental analysis at bottom of data for additional energy
balance items.
Heat exchanger efficiency = 0.98 [Rossi estimate]
E-cat Insulation Value (R) = 6.0 W/(K*m^2) [Higgins, estimate]
Est. E-cat surface area = 1.4 m^2           [Higgins, estimate]
Reactor flow rate, Fp = 13.0 liters / h     [Lewan, est.; changes with time,
var not used]
Reactor water leakage, FL = 2.0 liters / h at 2 bar internal     [Lewan, est.]
Exchanger flow rate, FE = 640.8 liters / h     [Lewan, measured]
E-cat total heat output = 33.76 kWH  = 121.5 MJ
Total electrical input energy = 8.97 kWH  = 32.3 MJ

(That didn't copy very well ...)

d) Residual Energy in Tank

Final Temp of water in E-cat = 97.7 C
Average Temp of input water to E-cat = 25.5 C
Temp difference of remaining water = 71.7 C
Est. volume of water in E-Cat at end =  20.0 liters remaining (est. liquid
volume remaining, some internal volume may be steam.)
Heat stored in E-Cat water = 1.667 kWH heat remaining in water at end of data
Weight of E-Cat =  98 kg
Average specific heat of E-Cat (est.) = 0.07 (presume an average of steel and
lead)
Est. Heat stored in E-Cat structure =  0.572 kWh heat remaining in E-Cat
structure at end of data