Hi Wally --

You will have seen my private message to you by now.
As  I read this thread, I think I see your problem.  Open Automatic Analysis
and open Formula Editor.  Use Formula Editor to open your Donchian.afl.
Click the "Apply Indicator" icon in the toolbar -- the little chart.  That
will open a new pane and display the plots in your code.

Thanks,
Howard

On Mon, Nov 3, 2008 at 5:51 PM, electricwally77 <[EMAIL PROTECTED]>wrote:

>   Hi Jerry,
>
> Thanks again for the help. Yes it runs fine on my system as well but
> I'm not seeing the actual Donchian Channel on my chart. I guess I'm
> not explaining my situation well enough . I'll try again. I'd like to
> see the actual Donchian channel displayed on my chart. I'm using the
> ETF symbol "SPY" (S&P 500 index).
>
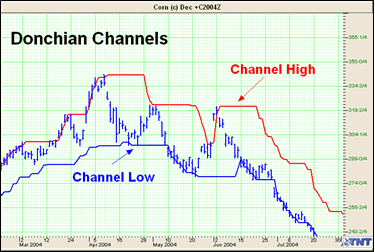
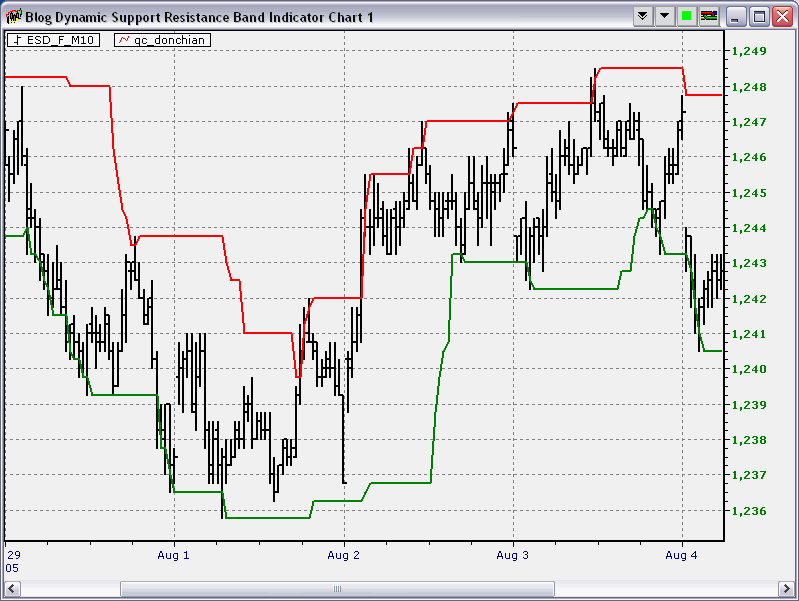
> Below is a link that shows what the "Donchian Channel" looks like on a
> chart. Forgive me if you already know this. I'm just trying to clarify
> my question.
>
> Please see....(or just go to Google "Images" and search for "Donchian
> Channel" and you will see all the charts the show a Donchian Channel"
> that I am trying to show on my chart.
>
> http://help.geckosoftware.com/40manual/new/use_indicators/don/pict_don.gif
>
> http://www.linnsoft.com/tour/techind/images/donchChart.jpg
>
>
> http://newsletter.neoticker.com/wp-content/uploads/2008/03/blogdynamicsupportresistancebandindicatorchart1.gif
>
>
> http://www.cmsfx.com/en/trading-software/vt-trader-features/many-technical-indicators/donchian-channel/
>
> Thank you
>
> Wally
>
> --- In [email protected] <amibroker%40yahoogroups.com>, "Jerry
> Gress"
> <[EMAIL PROTECTED]> wrote:
> >
> > Hi,
> >
> > All I did was take your formula and add Plot(C,"", etc. It plots ok here
> > without buy sell arrows. The below formula copy to the formula editor,
> > verify and apply to a new/old chart, works here. If that doesn't
> work then
> > you might want to send a picture of what you get on your screen,
> please feel
> > free to do it directly. Also remember I am not a programmer, just
> learned by
> > trying and watching this list.
> >
> > pds=30;
> > DonchianUpper =HHV(Ref(H,-1),pds);
> > DonchianLower = LLV(Ref(L,-1),pds);
> > DonchianMiddle = (DonchianUpper+DonchianLower)/2;
> >
> > Plot(DonchianUpper,"DU",colorBlue,styleLine);
> > Plot(DonchianMiddle,"DM",colorGreen,styleLine);
> > Plot(DonchianLower,"DL",colorRed,styleLine);
> >
> >
> > Buy = H > Ref(HHV(H,30),-1);
> > BuyPrice = Ref(HHV(H,30),-1);
> > Sell = L < Ref(LLV(L,30),-1);
> > SellPrice = Ref(LLV(L,30),-1);
> >
> > Buy = ExRem(Buy,Sell);
> > Sell = ExRem(Sell,Buy);
> >
> > Plot(C,"",colorGreen,styleBar| styleThick);
> >
> > Jerry Gress
> > Stockton, Ca.
> >
> >
> > -----Original Message-----
> > From: [email protected] <amibroker%40yahoogroups.com> [mailto:
> [email protected] <amibroker%40yahoogroups.com>]
> On Behalf
> > Of electricwally77
> > Sent: Monday, November 03, 2008 2:48 PM
> > To: [email protected] <amibroker%40yahoogroups.com>
> > Subject: [amibroker] Re: Show Donchian Channel on Chart
> >
> > Jerry
> >
> > >>>So check your view | layers to make sure you are on default.
> >
> > Yes I'm on Default
> >
> > >>>> Second make sure your background color of chart is not the same
> > as the price chart.
> >
> > Yes, its ok.
> >
> > Perhaps you can tell me how to code a basic 30 period donchian channel
> > so it appears on my chart. Much appreciated as I learn AFL code.
> >
> >
> > --- In [email protected] <amibroker%40yahoogroups.com>, "Jerry
> Gress"
> > <pleasenospamplease@> wrote:
> > >
> > > Hello electricwally 77!!
> > >
> > > Just took the code and charted fine, the price of underline. No
> > channels or
> > > buy sell arrows because they are not coded in sample code you gave
> > below.
> > > So check your view | layers to make sure you are on default. This
> > caught me
> > > out last week.
> > >
> > > Second make sure your background color of chart is not the same as
> > the price
> > > chart. Yes I know all red is weird, but when you have a black
> background
> > > chart then indicators plotted in black they do not show up.
> > >
> > >
> > > Lets see what the above does, then feel free to contact.
> > >
> > > Jerry Gress
> > > Stockton, Ca.
> > >
> > >
> > > -----Original Message-----
> > > From: [email protected] <amibroker%40yahoogroups.com> [mailto:
> [email protected] <amibroker%40yahoogroups.com>]
> > On Behalf
> > > Of electricwally77
> > > Sent: Monday, November 03, 2008 1:51 PM
> > > To: [email protected] <amibroker%40yahoogroups.com>
> > > Subject: [amibroker] Re: Show Donchian Channel on Chart
> > >
> > > Jerry Thank you. I placed the line of code you recommended and still
> > > nothing appeared on my chart. Only the buy and sell arrows.
> > >
> > > Here is the code I ran.
> > >
> > > Plot( C, "Close", colorRed, styleBar | styleThick );
> > >
> > > pds=30;
> > > Buy = H > Ref(HHV(H,30),-1);
> > > BuyPrice = Ref(HHV(H,30),-1);
> > > Sell = L < Ref(LLV(L,30),-1);
> > > SellPrice = Ref(LLV(L,30),-1);
> > >
> > > Buy = ExRem(Buy,Sell);
> > > Sell = ExRem(Sell,Buy);
> > >
> > > Thanks
> > > Wally
> > >
> > >
> > >
> > >
> > >
> > >
> > >
> > >
> > >
> > > --- In [email protected] <amibroker%40yahoogroups.com>, "Jerry
> Gress"
> > > <pleasenospamplease@> wrote:
> > > >
> > > > Hello,
> > > >
> > > > By "price channel" do you mean plot the price of the underline?
> > > >
> > > > If so:
> > > >
> > > > Plot( C, "Close", barcolor, styleBar | styleThick );
> > > >
> > > > Note barcolor is determinded by indicators, just put 'colorgreen'.
> > > >
> > > > Hope this helps,
> > > >
> > > > Jerry Gress
> > > > Stockton, Ca.
> > > >
> > > > Ps. You newbies always back up your stuff!!!
> > > >
> > > > -----Original Message-----
> > > > From: [email protected] <amibroker%40yahoogroups.com>[mailto:
> [email protected] <amibroker%40yahoogroups.com>]
> > > On Behalf
> > > > Of electricwally77
> > > > Sent: Monday, November 03, 2008 11:57 AM
> > > > To: [email protected] <amibroker%40yahoogroups.com>
> > > > Subject: [amibroker] Show Donchian Channel on Chart
> > > >
> > > > Hello, I'm trying to show the 30 period donchian channel on my
> chart.
> > > > The code seemed to run okay but I'd like to see the price channel
> > > > displayed on my chart. Appreciate the help. The code is listed
> below.
> > > >
> > > > pds=30;
> > > > DonchianUpper =HHV(Ref(H,-1),pds);
> > > > DonchianLower = LLV(Ref(L,-1),pds);
> > > > DonchianMiddle = (DonchianUpper+DonchianLower)/2;
> > > >
> > > > Plot(DonchianUpper,"DU",colorBlue,styleLine);
> > > > Plot(DonchianMiddle,"DM",colorGreen,styleLine);
> > > > Plot(DonchianLower,"DL",colorRed,styleLine);
> > > >
> > > > pds=30;
> > > > Buy = H > Ref(HHV(H,30),-1);
> > > > BuyPrice = Ref(HHV(H,30),-1);
> > > > Sell = L < Ref(LLV(L,30),-1);
> > > > SellPrice = Ref(LLV(L,30),-1);
> > > >
> > > > Buy = ExRem(Buy,Sell);
> > > > Sell = ExRem(Sell,Buy);
> > > >
> > > >
> > > > ------------------------------------
> > > >
> > > > **** IMPORTANT ****
> > > > This group is for the discussion between users only.
> > > > This is *NOT* technical support channel.
> > > >
> > > > *********************
> > > > TO GET TECHNICAL SUPPORT from AmiBroker please send an e-mail
> > > directly to
> > > > SUPPORT {at} amibroker.com
> > > > *********************
> > > >
> > > > For NEW RELEASE ANNOUNCEMENTS and other news always check DEVLOG:
> > > > http://www.amibroker.com/devlog/
> > > >
> > > > For other support material please check also:
> > > > http://www.amibroker.com/support.html
> > > >
> > > > *********************************
> > > > Yahoo! Groups Links
> > > >
> > >
> > >
> > >
> > > ------------------------------------
> > >
> > > **** IMPORTANT ****
> > > This group is for the discussion between users only.
> > > This is *NOT* technical support channel.
> > >
> > > *********************
> > > TO GET TECHNICAL SUPPORT from AmiBroker please send an e-mail
> > directly to
> > > SUPPORT {at} amibroker.com
> > > *********************
> > >
> > > For NEW RELEASE ANNOUNCEMENTS and other news always check DEVLOG:
> > > http://www.amibroker.com/devlog/
> > >
> > > For other support material please check also:
> > > http://www.amibroker.com/support.html
> > >
> > > *********************************
> > > Yahoo! Groups Links
> > >
> >
> >
> >
> > ------------------------------------
> >
> > **** IMPORTANT ****
> > This group is for the discussion between users only.
> > This is *NOT* technical support channel.
> >
> > *********************
> > TO GET TECHNICAL SUPPORT from AmiBroker please send an e-mail
> directly to
> > SUPPORT {at} amibroker.com
> > *********************
> >
> > For NEW RELEASE ANNOUNCEMENTS and other news always check DEVLOG:
> > http://www.amibroker.com/devlog/
> >
> > For other support material please check also:
> > http://www.amibroker.com/support.html
> >
> > *********************************
> > Yahoo! Groups Links
> >
>
>
>