Hello Howard, Yes it finally worked. I clicked on the "apply indicator
" in the "formula editor" and it displayed the "Donchian Channel"
successfully. The problem I was having was that I forgot to plot the
code for the Donchian Channel. Initially, all I had in my code was the
the Buy and Sell rules which executed the trades but did not show the
channel.
Jerry advised me to go to the AFL library to obtain the proper code to
plot the channel. I then took your advice and clicked on "Apply
Indicator" in the "formula editor" window which successfully plotted
the Donchian Channel (upper, mid and lower lines).

Your advice to add Plot(C,"C",colorBlack,styleBar| styleThick); which
plotted the price in a thick line for easier viewing was also very
necessary and helpful. Thank you all who helped me.

Below is the "Donchian Channel" plot code that I initially forgot to
include.

pds=60;
DonchianUpper =HHV(Ref(H,-1),pds);
DonchianLower = LLV(Ref(L,-1),pds);
DonchianMiddle = (DonchianUpper+DonchianLower)/2;


Plot(C,"C",colorBlack,styleBar| styleThick);

Plot(DonchianUpper,"DU",colorBlue,styleLine | styleThick);
Plot(DonchianMiddle,"DM",colorGreen,styleLine| styleThick);
Plot(DonchianLower,"DL",colorRed,styleLine| styleThick);


--- In [email protected], "Howard B" <[EMAIL PROTECTED]> wrote:
>
> Hi Wally --
>
> You will have seen my private message to you by now.
>
> As  I read this thread, I think I see your problem.  Open Automatic
Analysis
> and open Formula Editor.  Use Formula Editor to open your Donchian.afl.
> Click the "Apply Indicator" icon in the toolbar -- the little chart.
 That
> will open a new pane and display the plots in your code.
>
> Thanks,
> Howard
>
> On Mon, Nov 3, 2008 at 5:51 PM, electricwally77 <[EMAIL PROTECTED]>wrote:
>
> >   Hi Jerry,
> >
> > Thanks again for the help. Yes it runs fine on my system as well but
> > I'm not seeing the actual Donchian Channel on my chart. I guess I'm
> > not explaining my situation well enough . I'll try again. I'd like to
> > see the actual Donchian channel displayed on my chart. I'm using the
> > ETF symbol "SPY" (S&P 500 index).
> >
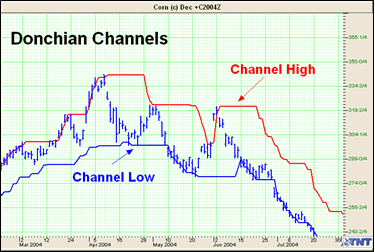
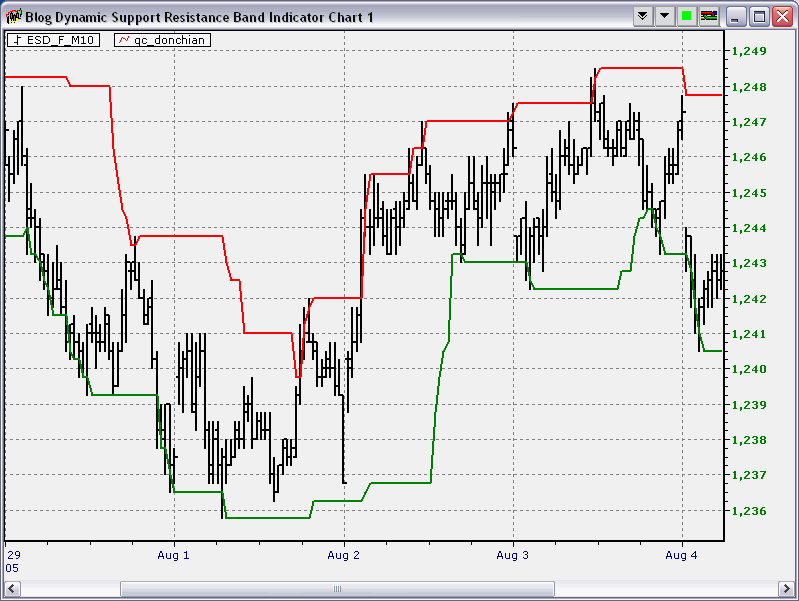
> > Below is a link that shows what the "Donchian Channel" looks like on a
> > chart. Forgive me if you already know this. I'm just trying to clarify
> > my question.
> >
> > Please see....(or just go to Google "Images" and search for "Donchian
> > Channel" and you will see all the charts the show a Donchian Channel"
> > that I am trying to show on my chart.
> >
> >
http://help.geckosoftware.com/40manual/new/use_indicators/don/pict_don.gif
> >
> > http://www.linnsoft.com/tour/techind/images/donchChart.jpg
> >
> >
> >
http://newsletter.neoticker.com/wp-content/uploads/2008/03/blogdynamicsupportresistancebandindicatorchart1.gif
> >
> >
> >
http://www.cmsfx.com/en/trading-software/vt-trader-features/many-technical-indicators/donchian-channel/
> >
> > Thank you
> >
> > Wally
> >
> > --- In [email protected] <amibroker%40yahoogroups.com>, "Jerry
> > Gress"
> > <pleasenospamplease@> wrote:
> > >
> > > Hi,
> > >
> > > All I did was take your formula and add Plot(C,"", etc. It plots
ok here
> > > without buy sell arrows. The below formula copy to the formula
editor,
> > > verify and apply to a new/old chart, works here. If that doesn't
> > work then
> > > you might want to send a picture of what you get on your screen,
> > please feel
> > > free to do it directly. Also remember I am not a programmer, just
> > learned by
> > > trying and watching this list.
> > >
> > > pds=30;
> > > DonchianUpper =HHV(Ref(H,-1),pds);
> > > DonchianLower = LLV(Ref(L,-1),pds);
> > > DonchianMiddle = (DonchianUpper+DonchianLower)/2;
> > >
> > > Plot(DonchianUpper,"DU",colorBlue,styleLine);
> > > Plot(DonchianMiddle,"DM",colorGreen,styleLine);
> > > Plot(DonchianLower,"DL",colorRed,styleLine);
> > >
> > >
> > > Buy = H > Ref(HHV(H,30),-1);
> > > BuyPrice = Ref(HHV(H,30),-1);
> > > Sell = L < Ref(LLV(L,30),-1);
> > > SellPrice = Ref(LLV(L,30),-1);
> > >
> > > Buy = ExRem(Buy,Sell);
> > > Sell = ExRem(Sell,Buy);
> > >
> > > Plot(C,"",colorGreen,styleBar| styleThick);
> > >
> > > Jerry Gress
> > > Stockton, Ca.
> > >
> > >
> > > -----Original Message-----
> > > From: [email protected] <amibroker%40yahoogroups.com>
[mailto:
> > [email protected] <amibroker%40yahoogroups.com>]
> > On Behalf
> > > Of electricwally77
> > > Sent: Monday, November 03, 2008 2:48 PM
> > > To: [email protected] <amibroker%40yahoogroups.com>
> > > Subject: [amibroker] Re: Show Donchian Channel on Chart
> > >
> > > Jerry
> > >
> > > >>>So check your view | layers to make sure you are on default.
> > >
> > > Yes I'm on Default
> > >
> > > >>>> Second make sure your background color of chart is not the same
> > > as the price chart.
> > >
> > > Yes, its ok.
> > >
> > > Perhaps you can tell me how to code a basic 30 period donchian
channel
> > > so it appears on my chart. Much appreciated as I learn AFL code.
> > >
> > >
> > > --- In [email protected] <amibroker%40yahoogroups.com>,
"Jerry
> > Gress"
> > > <pleasenospamplease@> wrote:
> > > >
> > > > Hello electricwally 77!!
> > > >
> > > > Just took the code and charted fine, the price of underline. No
> > > channels or
> > > > buy sell arrows because they are not coded in sample code you gave
> > > below.
> > > > So check your view | layers to make sure you are on default. This
> > > caught me
> > > > out last week.
> > > >
> > > > Second make sure your background color of chart is not the same as
> > > the price
> > > > chart. Yes I know all red is weird, but when you have a black
> > background
> > > > chart then indicators plotted in black they do not show up.
> > > >
> > > >
> > > > Lets see what the above does, then feel free to contact.
> > > >
> > > > Jerry Gress
> > > > Stockton, Ca.
> > > >
> > > >
> > > > -----Original Message-----
> > > > From: [email protected] <amibroker%40yahoogroups.com>
[mailto:
> > [email protected] <amibroker%40yahoogroups.com>]
> > > On Behalf
> > > > Of electricwally77
> > > > Sent: Monday, November 03, 2008 1:51 PM
> > > > To: [email protected] <amibroker%40yahoogroups.com>
> > > > Subject: [amibroker] Re: Show Donchian Channel on Chart
> > > >
> > > > Jerry Thank you. I placed the line of code you recommended and
still
> > > > nothing appeared on my chart. Only the buy and sell arrows.
> > > >
> > > > Here is the code I ran.
> > > >
> > > > Plot( C, "Close", colorRed, styleBar | styleThick );
> > > >
> > > > pds=30;
> > > > Buy = H > Ref(HHV(H,30),-1);
> > > > BuyPrice = Ref(HHV(H,30),-1);
> > > > Sell = L < Ref(LLV(L,30),-1);
> > > > SellPrice = Ref(LLV(L,30),-1);
> > > >
> > > > Buy = ExRem(Buy,Sell);
> > > > Sell = ExRem(Sell,Buy);
> > > >
> > > > Thanks
> > > > Wally
> > > >
> > > >
> > > >
> > > >
> > > >
> > > >
> > > >
> > > >
> > > >
> > > > --- In [email protected]
<amibroker%40yahoogroups.com>, "Jerry
> > Gress"
> > > > <pleasenospamplease@> wrote:
> > > > >
> > > > > Hello,
> > > > >
> > > > > By "price channel" do you mean plot the price of the underline?
> > > > >
> > > > > If so:
> > > > >
> > > > > Plot( C, "Close", barcolor, styleBar | styleThick );
> > > > >
> > > > > Note barcolor is determinded by indicators, just put
'colorgreen'.
> > > > >
> > > > > Hope this helps,
> > > > >
> > > > > Jerry Gress
> > > > > Stockton, Ca.
> > > > >
> > > > > Ps. You newbies always back up your stuff!!!
> > > > >
> > > > > -----Original Message-----
> > > > > From: [email protected]
<amibroker%40yahoogroups.com>[mailto:
> > [email protected] <amibroker%40yahoogroups.com>]
> > > > On Behalf
> > > > > Of electricwally77
> > > > > Sent: Monday, November 03, 2008 11:57 AM
> > > > > To: [email protected] <amibroker%40yahoogroups.com>
> > > > > Subject: [amibroker] Show Donchian Channel on Chart
> > > > >
> > > > > Hello, I'm trying to show the 30 period donchian channel on my
> > chart.
> > > > > The code seemed to run okay but I'd like to see the price
channel
> > > > > displayed on my chart. Appreciate the help. The code is listed
> > below.
> > > > >
> > > > > pds=30;
> > > > > DonchianUpper =HHV(Ref(H,-1),pds);
> > > > > DonchianLower = LLV(Ref(L,-1),pds);
> > > > > DonchianMiddle = (DonchianUpper+DonchianLower)/2;
> > > > >
> > > > > Plot(DonchianUpper,"DU",colorBlue,styleLine);
> > > > > Plot(DonchianMiddle,"DM",colorGreen,styleLine);
> > > > > Plot(DonchianLower,"DL",colorRed,styleLine);
> > > > >
> > > > > pds=30;
> > > > > Buy = H > Ref(HHV(H,30),-1);
> > > > > BuyPrice = Ref(HHV(H,30),-1);
> > > > > Sell = L < Ref(LLV(L,30),-1);
> > > > > SellPrice = Ref(LLV(L,30),-1);
> > > > >
> > > > > Buy = ExRem(Buy,Sell);
> > > > > Sell = ExRem(Sell,Buy);
> > > > >
> > > > >
> > > > > ------------------------------------
> > > > >
> > > > > **** IMPORTANT ****
> > > > > This group is for the discussion between users only.
> > > > > This is *NOT* technical support channel.
> > > > >
> > > > > *********************
> > > > > TO GET TECHNICAL SUPPORT from AmiBroker please send an e-mail
> > > > directly to
> > > > > SUPPORT {at} amibroker.com
> > > > > *********************
> > > > >
> > > > > For NEW RELEASE ANNOUNCEMENTS and other news always check
DEVLOG:
> > > > > http://www.amibroker.com/devlog/
> > > > >
> > > > > For other support material please check also:
> > > > > http://www.amibroker.com/support.html
> > > > >
> > > > > *********************************
> > > > > Yahoo! Groups Links
> > > > >
> > > >
> > > >
> > > >
> > > > ------------------------------------
> > > >
> > > > **** IMPORTANT ****
> > > > This group is for the discussion between users only.
> > > > This is *NOT* technical support channel.
> > > >
> > > > *********************
> > > > TO GET TECHNICAL SUPPORT from AmiBroker please send an e-mail
> > > directly to
> > > > SUPPORT {at} amibroker.com
> > > > *********************
> > > >
> > > > For NEW RELEASE ANNOUNCEMENTS and other news always check DEVLOG:
> > > > http://www.amibroker.com/devlog/
> > > >
> > > > For other support material please check also:
> > > > http://www.amibroker.com/support.html
> > > >
> > > > *********************************
> > > > Yahoo! Groups Links
> > > >
> > >
> > >
> > >
> > > ------------------------------------
> > >
> > > **** IMPORTANT ****
> > > This group is for the discussion between users only.
> > > This is *NOT* technical support channel.
> > >
> > > *********************
> > > TO GET TECHNICAL SUPPORT from AmiBroker please send an e-mail
> > directly to
> > > SUPPORT {at} amibroker.com
> > > *********************
> > >
> > > For NEW RELEASE ANNOUNCEMENTS and other news always check DEVLOG:
> > > http://www.amibroker.com/devlog/
> > >
> > > For other support material please check also:
> > > http://www.amibroker.com/support.html
> > >
> > > *********************************
> > > Yahoo! Groups Links
> > >
> >
> >
> >
>