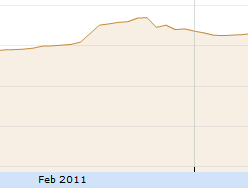
OK, so here's something ironic... TreKing assets that breakages (like the
install percentage) precede Market changes, right? Well, the recent addition
of Statistics actually provides its own evidence for this view! I had one
app - my top seller, of course - affected by the install percentage drop
that this thread was originally about. And here is its "Accumulated
installs" graph for the period in question:
<https://lh4.googleusercontent.com/_ydWSe2MyJEU/TYEv3hyIYnI/AAAAAAAAA2Y/RqKScT0DpJA/terratime_graph.png>

This graph is completely unlike any of my other apps, and I'll wager it's
unlike most of yours too - except for you, Zsolt. Every other app is almost
monotonically increasing, apart from very occasional (and small) peaks. This
kind of wholesale dropoff is singular.

I'm seriously hoping that this breakage - whatever it was - is now past, and
the app in question will eventually return to normal sales levels. But it
still sucks.

String

--
You received this message because you are subscribed to the Google
Groups "Android Developers" group.
To post to this group, send email to [email protected]
To unsubscribe from this group, send email to
[email protected]
For more options, visit this group at
http://groups.google.com/group/android-developers?hl=en