Hi all,

I am quite new to AngularJS and specifically chart rendering through it. I
have currently spent the most time looking at D3 and I think that's what I
will probably go with for the simple pie/donut/line/bar charts I require.
I've spent a couple of weeks looking at directives and that's clearly the
way to go for what I require.
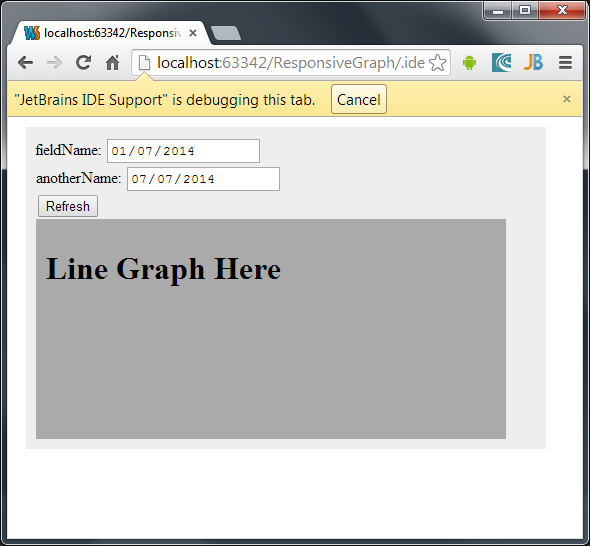
I would like to create a directive that I can supply to colleagues and have
them build reasonably complex elements without having  any particular
knowledge of the underlying code.

I am by no means asking anyone to tell me exactly how to do it, I'm just
trying to make sure it's possible and that I haven't missed a glaring
limitation with Angular. That said, if you are able to show me anything
details, be my guest :D

Right, I would like to turn something like this this

<my-bar-chart data-api="www.someserver.com/data/graph"
data-filter="[['fieldName','date'],['anotherName','date']]"
data-type="line"></my-bar-chart>

Into something like this (crude styling to be ignored)

<https://lh4.googleusercontent.com/-Hazthes_gPI/U7bPmbfYu1I/AAAAAAAAABc/pekBf3b_vic/s1600/chart.png>

Pressing refresh makes a $http call to the data-api location, providing the
specified filters (fieldName and anotherName, both of which are date
fields) with the $http post. The server takes this request and returns the
relevant data in JSON format. The directive renders this data as a line
chart (specified with data-type) in the designated area ("Line Graph Here")

So, is that possible?

Thanks

-Chris

--
You received this message because you are subscribed to the Google Groups
"AngularJS" group.
To unsubscribe from this group and stop receiving emails from it, send an email
to [email protected].
To post to this group, send email to [email protected].
Visit this group at http://groups.google.com/group/angular.
For more options, visit https://groups.google.com/d/optout.