The time-scale on your charts is ~seconds.  But everything after the
first half-second is noise.  The room reverb which you can see in the
first half-second or less, is pretty much a straight-line slope (on the
dB vertical scale).
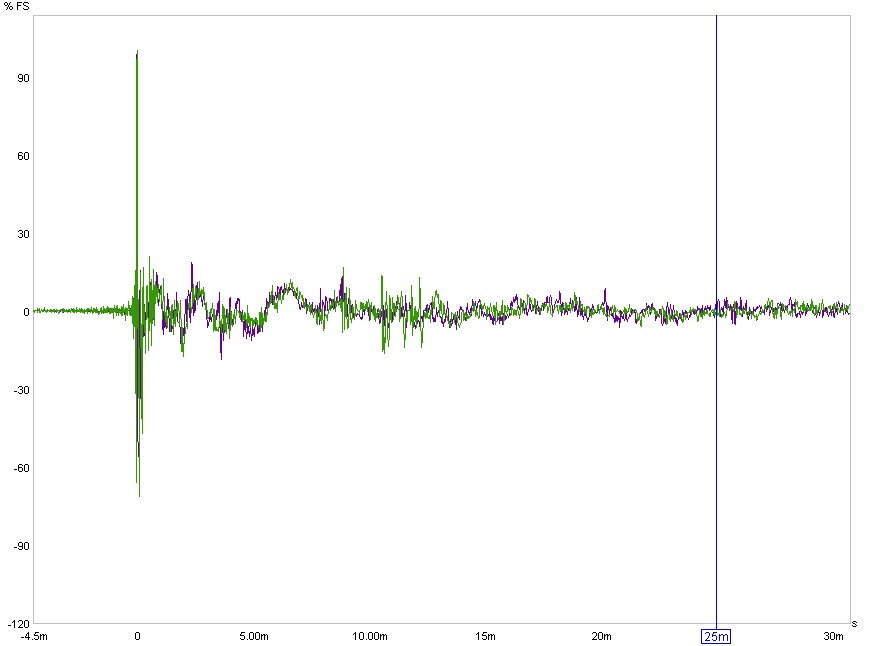
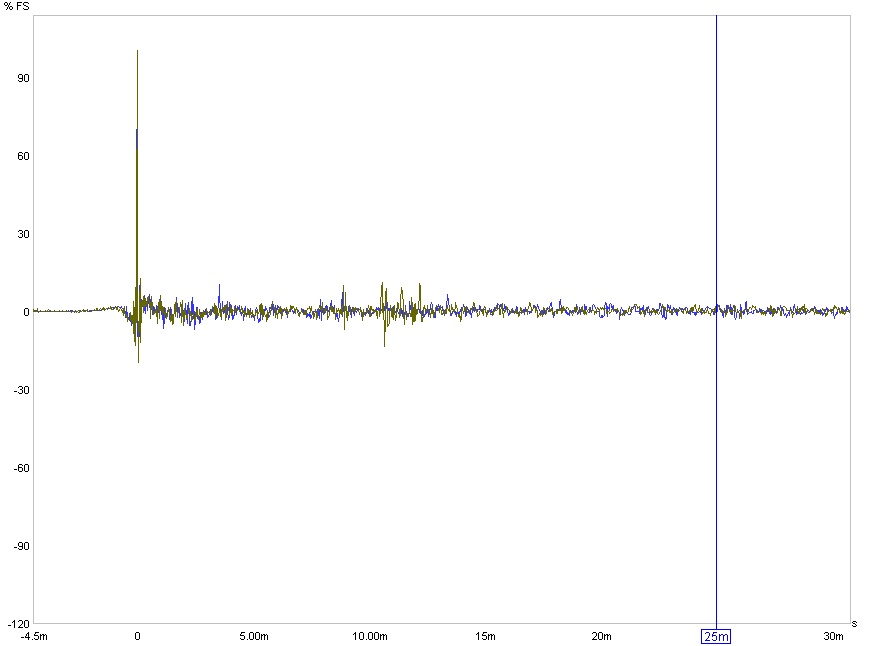
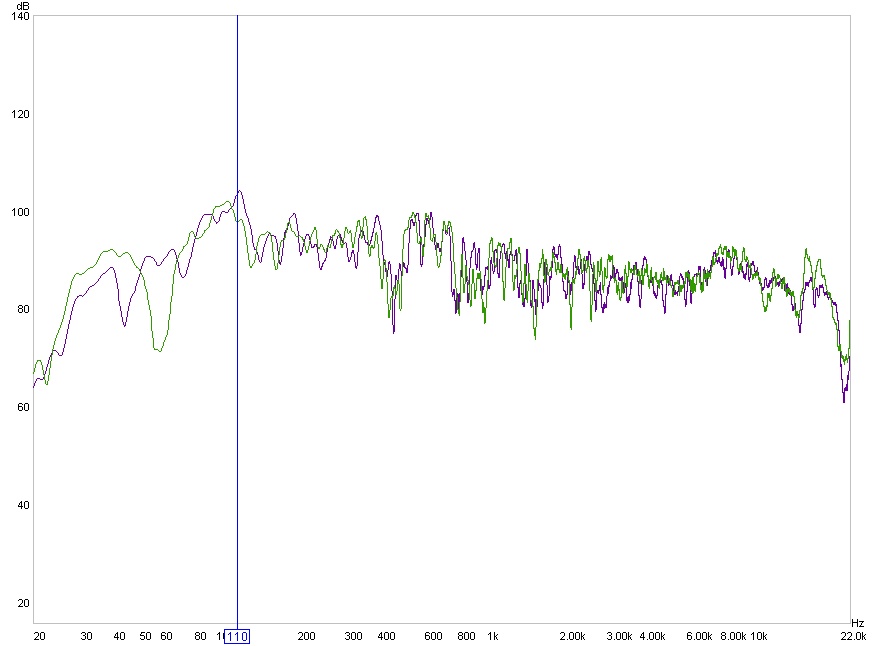
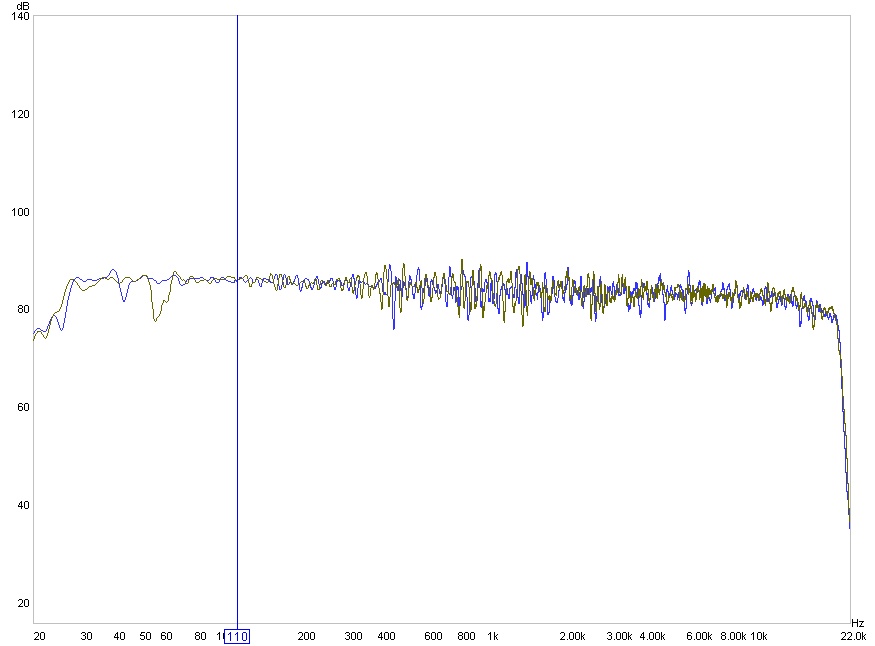
Room correction won't fundamentally alter the room-reverb
characteristic.  After all, if you put a certain amount of acoustic
power into the room, it bounces around until it decays regardless the
detail of the sound.  But it does fix early reflections and bass modes
quite effectively.

Early reflections are easily seen on the impulse response with a linear
vertical scale, and a timescale less than approx 30ms.

Mine, measured before correction (both channels overlayed, so it's a
bit messy), with linear vertical scale:
http://inguzaudio.com/img/uncorrected_impulse.jpg
Measured with 'strong' correction:
http://inguzaudio.com/img/corrected_impulse.jpg
Neither of these pictures has much in the way of coherent early
reflection, but you do see a lot of signal cleanup.

Bass modes are quite hard to see on a chart of the impulse response.
They're easier to see on frequency-response magnitude graphs.

Mine, frequency response magnitude, before:
http://inguzaudio.com/img/uncorrected_fr_12tho.jpg
(with 1/12th octave smoothing)
After (as measured, not simulated...):
http://inguzaudio.com/img/corrected_fr_12tho.jpg
The peak at 110Hz is almost gone.  The null at 55Hz is still there, but
weaker.


--
inguz
------------------------------------------------------------------------
inguz's Profile: http://forums.slimdevices.com/member.php?userid=1139
View this thread: http://forums.slimdevices.com/showthread.php?t=35615

_______________________________________________
audiophiles mailing list
[email protected]
http://lists.slimdevices.com/lists/listinfo/audiophiles