On 22/01/19 20:01, Ashok Nayak wrote:
>
> I need to draw the solvent accessible surface representation figure
> for a cation channel pore from the channel coordinates. The Hole
> program and the documentation is already handy to obtain the 2D-plot
> (pore radius vs channel coordinate) and the coloured dot surface but
> is limiting for a publishable figure.
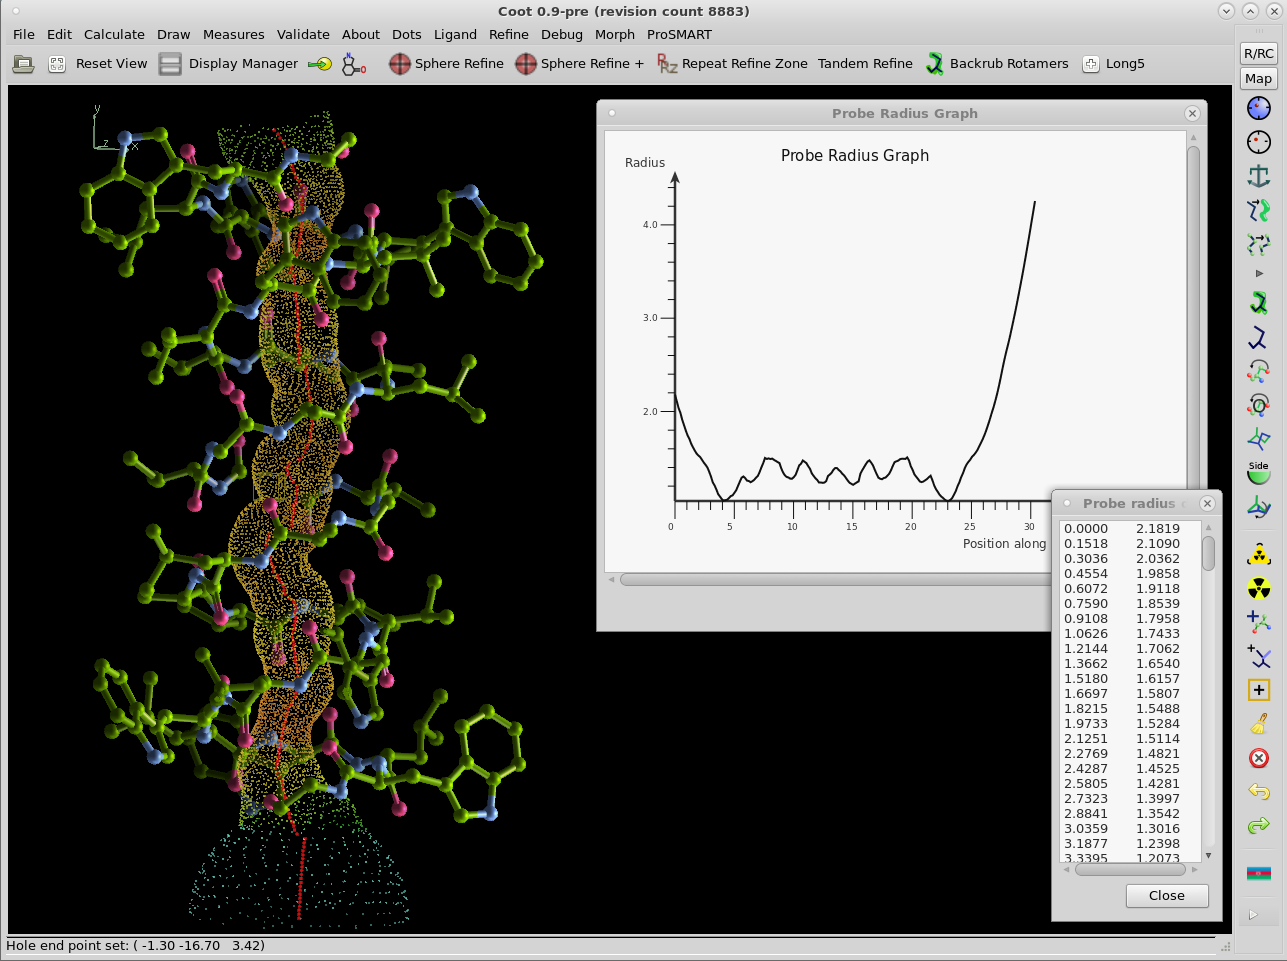
FYI, Coot has an implementation of HOLE

https://www2.mrc-lmb.cam.ac.uk/personal/pemsley/coot/web/screenshots/HOLE-example.png

which produces a dots file with entries like

      # x y z r g b hexcol
      -0.64576   13.65208    5.07769       0.57820    0.86240
0.20800  #93db35
      -0.64576   13.65208    5.07769       0.57820    0.86240
0.20800  #93db35
      -0.64576   13.65208    5.07769       0.57820    0.86240
0.20800  #93db35
      -0.64576   13.65208    5.07769       0.57820    0.86240
0.20800  #93db35
      -0.64576   13.65208    5.07769       0.57820    0.86240
0.20800  #93db35

which you can then display in your favourite graphics program, filtering
out the points that the wrong colour.

Regards,

Paul.

########################################################################

To unsubscribe from the CCP4BB list, click the following link:
https://www.jiscmail.ac.uk/cgi-bin/webadmin?SUBED1=CCP4BB&A=1