This is an automated email from the ASF dual-hosted git repository.

lahirujayathilake pushed a commit to branch master
in repository https://gitbox.apache.org/repos/asf/airavata.git
commit 741815f673a355ffb8f63b38f0863fcdcf8a3832 Author: yasith <[email protected]> AuthorDate: Tue Feb 18 05:36:53 2025 -0600 temp commit to get cyberfaces meeting poc --- .../airavata-agent/jupyter/Dockerfile | 31 +- .../airavata-agent/jupyter/analysis.ipynb | 867 +++++++++++++++++++++ .../airavata-agent/jupyter/data.tar.gz | Bin 0 -> 15023336 bytes .../jupyter/labconfig/airavata_magics.py | 10 +- .../airavata-agent/jupyter/labconfig/bootstrap.sh | 1 - 5 files changed, 891 insertions(+), 18 deletions(-) diff --git a/modules/agent-framework/airavata-agent/jupyter/Dockerfile b/modules/agent-framework/airavata-agent/jupyter/Dockerfile index 66f92f50df..5ca284a63d 100644 --- a/modules/agent-framework/airavata-agent/jupyter/Dockerfile +++ b/modules/agent-framework/airavata-agent/jupyter/Dockerfile @@ -1,16 +1,17 @@ -FROM python:3.12-slim +FROM rkalyana/iguide-singleuser-cvmfs:nbfetch -RUN apt update -RUN apt install fuse -y -RUN pip install notebook -RUN apt install kmod -y -RUN apt install git -y -RUN pip install PyJWT -RUN pip install cybershuttle-tune==0.1.19 -RUN pip install scipy -RUN pip install numpy +USER root + +RUN pip install pandas +RUN pip install geopandas +RUN pip install pygeos RUN pip install matplotlib -RUN git clone https://github.com/cyber-shuttle/jupyter-notebook-examples /home/jupyter-notebook-examples +RUN pip install "numpy<2" +RUN apt update +RUN apt install -y gdal-bin +RUN pip install -U libpysal +RUN pip install -U esda +RUN pip3 install contextily COPY labconfig/jupyter_lab_config.py /jupyter_lab_config.py COPY labconfig/airavata_magics.py /airavata_magics.py @@ -19,7 +20,9 @@ COPY labconfig/device_auth.py /device_auth.py COPY labconfig/bootstrap.sh /bootstrap.sh RUN chmod +x /bootstrap.sh -EXPOSE 8888 -WORKDIR /home +COPY data.tar.gz /home/jovyan/data.tar.gz +COPY analysis.ipynb /home/jovyan/analysis.ipynb + +USER ${NB_UID} -ENTRYPOINT ["sh", "/bootstrap.sh"] +CMD ["start-notebook.sh","--NotebookApp.iopub_data_rate_limit=1e10"] diff --git a/modules/agent-framework/airavata-agent/jupyter/analysis.ipynb b/modules/agent-framework/airavata-agent/jupyter/analysis.ipynb new file mode 100644 index 0000000000..c95d3bc204 --- /dev/null +++ b/modules/agent-framework/airavata-agent/jupyter/analysis.ipynb @@ -0,0 +1,867 @@ +{ + "cells": [ + { + "cell_type": "markdown", + "id": "769a199b", + "metadata": {}, + "source": [ + "# Local spatial correlation between the social vulnerability of population and inundation risk of dam failure\n", + "\n", + "This notebook demonstrates how the social vulnerability of the population (i.e., socially disadvantaged or non-disadvantaged) is spatially correlated with the inundation risk of a dam failure, focusing on a single dam. The analysis consists of the following two steps.\n", + "1. it identifies census blocks inundated from flooding caused by three dam failure scenarios with different water levels: normal high (NH), top of active storage (TAS), and maximum high (MH), retrived from the National Inventory of Dams (NID) of US Army Corps of Engineers. \n", + "2. it employs two spatial correlation metrics (i.e., Bivariate Moran’s I and Bivariate Local Indicator of Spatial Association (LISA)) to investigate the relationship between the inundation risk and social vulnerability of the population per impacted locations from a single dam failure. In this context, we employed 16 census variables related to the social vulnerability index.\n", + "\n", + "| Acronym | Note |\n", + "|---------|---------------------------------|\n", + "| POV150 | Below 150% Poverty |\n", + "| UNEMP | Unemployment Rate |\n", + "| HBURD | Housing Cost Burden |\n", + "| NOHSDP | No High School Diploma |\n", + "| NOINSUR | No Health Insurance |\n", + "| AGE65 | Aged 65 & Older |\n", + "| AGE17 | Aged 17 & Younger |\n", + "| DISABL | Civilian with a Disability |\n", + "| SNGPNT | Single-Parent Households |\n", + "| LIMENG | English Language Proficiency |\n", + "| MINRTY | Racial & Ethnic Minority Status |\n", + "| MUNIT | Multi-Unit Structures |\n", + "| MOBILE | Mobile Homes |\n", + "| CROWD | Crowding |\n", + "| NOVEH | No Vehicle Household |\n", + "| GROUPQ | Group Quarters |\n" + ] + }, + { + "cell_type": "markdown", + "id": "9ada5513", + "metadata": {}, + "source": [ + "### Remote Cell Execution" + ] + }, + { + "cell_type": "markdown", + "id": "d9c4a169", + "metadata": {}, + "source": [ + "#### Load remote cell execution plugin" + ] + }, + { + "cell_type": "code", + "execution_count": null, + "id": "41d9e046-cd40-4ae4-9076-e7fe0ec8b378", + "metadata": {}, + "outputs": [], + "source": [ + "import sys\n", + "sys.path.append('/')\n", + "import airavata_magics\n", + "airavata_magics.load_ipython_extension(get_ipython())" + ] + }, + { + "cell_type": "markdown", + "id": "d882c035", + "metadata": {}, + "source": [ + "#### Authenticate" + ] + }, + { + "cell_type": "code", + "execution_count": null, + "id": "9ed61023", + "metadata": {}, + "outputs": [], + "source": [ + "%cs_login" + ] + }, + { + "cell_type": "markdown", + "id": "1fc1082f", + "metadata": {}, + "source": [ + "#### Initialize the remote execution agent. Provide the computation requirements and target cluster name" + ] + }, + { + "cell_type": "code", + "execution_count": null, + "id": "f116ac05", + "metadata": {}, + "outputs": [], + "source": [ + "%init_remote cluster=Anvil cpu=4 memory=4096 queue=shared walltime=60 group=CyberFaCES" + ] + }, + { + "cell_type": "markdown", + "id": "1cddc213", + "metadata": {}, + "source": [ + "#### Wait for agent to come online" + ] + }, + { + "cell_type": "code", + "execution_count": null, + "id": "1c63906b", + "metadata": {}, + "outputs": [], + "source": [ + "%status_remote" + ] + }, + { + "cell_type": "markdown", + "id": "7664b5cf", + "metadata": {}, + "source": [ + "#### Running Remote Commands" + ] + }, + { + "cell_type": "code", + "execution_count": null, + "id": "46223ddd-6ad6-45ca-b5a0-ce4b80575091", + "metadata": {}, + "outputs": [], + "source": [ + "%%run_remote\n", + "!ls" + ] + }, + { + "cell_type": "markdown", + "id": "213e87d6", + "metadata": {}, + "source": [ + "#### Upload Data Files" + ] + }, + { + "cell_type": "code", + "execution_count": null, + "id": "de9ea9a1-7337-4763-a47d-df4b5059d915", + "metadata": {}, + "outputs": [], + "source": [ + "%push_remote source=data.tar.gz target=data.tar.gz" + ] + }, + { + "cell_type": "code", + "execution_count": null, + "id": "7d40a170", + "metadata": {}, + "outputs": [], + "source": [ + "%%run_remote\n", + "!ls" + ] + }, + { + "cell_type": "markdown", + "id": "4fe8fe7a", + "metadata": {}, + "source": [ + "#### Download Data Files" + ] + }, + { + "cell_type": "code", + "execution_count": null, + "id": "f53b9d4f-8de4-4dcd-aebb-c60be9ef31dc", + "metadata": {}, + "outputs": [], + "source": [ + "%pull_remote source=AiravataAgent.stdout target=AiravataAgent.stdout" + ] + }, + { + "cell_type": "code", + "execution_count": null, + "id": "b60d0730", + "metadata": {}, + "outputs": [], + "source": [ + "!cat AiravataAgent.stdout" + ] + }, + { + "cell_type": "markdown", + "id": "8f897049", + "metadata": {}, + "source": [ + "#### To Stop the Agent run" + ] + }, + { + "cell_type": "code", + "execution_count": null, + "id": "c404db19", + "metadata": {}, + "outputs": [], + "source": [ + "# %terminate_remote" + ] + }, + { + "cell_type": "code", + "execution_count": null, + "id": "b0bc48d6", + "metadata": {}, + "outputs": [], + "source": [ + "%%run_remote\n", + "# Import necessary packages\n", + "import os\n", + "import pandas as pd\n", + "import geopandas as gpd\n", + "import subprocess\n", + "import json\n", + "import pygeos\n", + "import requests\n", + "import matplotlib.pyplot as plt\n", + "from matplotlib.colors import LinearSegmentedColormap\n", + "\n", + "\n", + "try:\n", + " import libpysal\n", + "except:\n", + " !pip install -U libpysal\n", + " import libpysal\n", + " \n", + "try:\n", + " import esda\n", + "except:\n", + " !pip install -U esda\n", + " import esda\n", + "try:\n", + " import contextily as cx\n", + "except:\n", + " !pip3 install contextily\n", + " import contextily as cx\n" + ] + }, + { + "cell_type": "markdown", + "id": "956a91db", + "metadata": {}, + "source": [ + "## 0. Set up environment varialbes" + ] + }, + { + "cell_type": "code", + "execution_count": null, + "id": "69cbdaa0", + "metadata": {}, + "outputs": [], + "source": [ + "%%run_remote\n", + "\n", + "# Working directory\n", + "data_dir = '/data/sample_data'\n", + "output_dir = os.getcwd()\n", + "\n", + "# Find the list of dams \n", + "fed_dams = pd.read_csv('/data/dam_list.csv')\n", + "fed_dams = gpd.GeoDataFrame(fed_dams, geometry=gpd.points_from_xy(fed_dams['LON'], fed_dams['LAT'], crs=\"EPSG:4326\"))\n", + "print(f'Total count of dams available for local analysis: {fed_dams.shape[0]}')\n", + "\n", + "# Dam of Interest\n", + "dam_id = 'CA10022' # example dam for demonstrating local analysis\n", + "API_Key = 'ENTER CENSUS API KEY HERE' # The API key can be obtained through https://api.census.gov/data/key_signup.html\n";, + "\n", + "print(f'Dam of Interest: {dam_id}')" + ] + }, + { + "cell_type": "markdown", + "id": "0229db15", + "metadata": {}, + "source": [ + "## 1. Find census blocks impacted by three dam failure scenarios\n", + "\n", + "Spatial intersections are conducted to find the submerged census blocks from three dam failure scenarios (i.e., breach of dam structure with the water level of normal high (NH), top of active storage (TAS), and maximum high (MH)). <br> Per each scenario, <br>\n", + "1. we vectorized the original raster into a polygon and spatially queried census blocks using Boolean logic. In other words, a census block has a value of one if it intersects with the inundation polygon; otherwise, it has zero. \n", + "2. we overlaid three polygons from three dam breach scenarios (i.e., MH, TAS, and NH) to estimate the potential risk of flooding. <br>\n", + "3. we found census blocks that intersected with the polygonized geometry and then kept the highest inundation risk value (i.e., 1~3) per census block. \n", + "\n", + "As a result, the inundation risk of a single dam failure provides polygons with values ranging from one through three. A census block with a value of three means the location will be submerged for every scenario (NH, TAS, and MH), whereas a polygon having a value of one means that the area would only get impacted for the worst-case scenario (MH breach)." + ] + }, + { + "cell_type": "markdown", + "id": "a30e85e6", + "metadata": {}, + "source": [ + "### 1.1. Vectorize inundations of three scenarios and overlaid them" + ] + }, + { + "cell_type": "code", + "execution_count": null, + "id": "fafd5982", + "metadata": {}, + "outputs": [], + "source": [ + "%%run_remote\n", + "\n", + "def resample_raster(rasterfile_path, filename, target_path, rescale_factor):\n", + " # first determine pixel size for resampling\n", + " xres = 0\n", + " yres = 0\n", + " \n", + " out = subprocess.run([\"gdalinfo\",\"-json\",rasterfile_path],stdout=subprocess.PIPE)\n", + " raster_meta = json.loads(out.stdout.decode('utf-8'))\n", + " if 'geoTransform' in raster_meta:\n", + " xres = raster_meta['geoTransform'][1]\n", + " yres = raster_meta['geoTransform'][5]\n", + " xres = xres * rescale_factor\n", + " yres = yres * rescale_factor\n", + "\n", + " if (xres != 0) and (yres != 0):\n", + " # resample raster\n", + " save_path = target_path +\"/\"+ filename + f\"_resample.tiff\"\n", + " subprocess.run([\"gdalwarp\",\"-r\",\"bilinear\",\"-of\",\"GTiff\",\"-tr\",str(xres),str(yres),rasterfile_path,save_path])\n", + "\n", + " return save_path, raster_meta\n", + "\n", + "def polygonize_fim(rasterfile_path, target_path):\n", + "\n", + " # Extract target path and filename from the given raster file path\n", + " # target_path = '/'.join(rasterfile_path.split('/')[:-1])\n", + " filename = rasterfile_path.split(\"/\")[-1].split(\".\")[-2]\n", + "\n", + " # Define paths\n", + " resample_path = target_path +\"/\"+ filename + f\"_resample.tiff\"\n", + " reclass_file = target_path + \"/\" + filename + \"_reclass.tiff\"\n", + " geojson_out = \"%s/%s.json\" % (target_path, filename)\n", + "\n", + " for temp_path_ in [resample_path, reclass_file, geojson_out]:\n", + " if os.path.exists(temp_path_):\n", + " os.remove(temp_path_)\n", + "\n", + " # Resample raster file to 10-times smaller\n", + " resample_path, raster_meta = resample_raster(rasterfile_path, filename, target_path, rescale_factor=4)\n", + "\n", + " # Reclassify raster\n", + " outfile = \"--outfile=\"+reclass_file\n", + " print(outfile)\n", + " no_data_val = raster_meta['bands'][0]['noDataValue']\n", + " # subprocess.run([\"gdal_calc.py\",\"-A\",resample_path,outfile,f\"--calc=1*(A>0)\",f\"--NoDataValue={no_data_val}\"],stdout=subprocess.PIPE)\n", + " subprocess.run([\"gdal_calc.py\",\"-A\",resample_path,outfile,f\"--calc=-9999*(A<=0)+1*(A>0)\",f\"--NoDataValue={no_data_val}\"],stdout=subprocess.PIPE)\n", + " \n", + " # Polygonize the reclassified raster\n", + " subprocess.run([\"gdal_polygonize.py\", reclass_file, \"-b\", \"1\", geojson_out, filename, \"value\"])\n", + "\n", + " inund_polygons = gpd.read_file(geojson_out)\n", + "\n", + " # If GeoDataFrame has records\n", + " if inund_polygons.shape[0] != 0:\n", + " inund_polygons = inund_polygons.loc[(inund_polygons['value'] != -9999) & (inund_polygons['value'] != 0)] # Remove pixels of null value\n", + "\n", + " # drop invalid geometries\n", + " inund_polygons = inund_polygons.loc[inund_polygons['geometry'].is_valid, :]\n", + "\n", + " # Coverage for each class of inundation map\n", + " inund_per_cls = inund_polygons.dissolve(by='value')\n", + " inund_per_cls.reset_index(inplace=True)\n", + "\n", + " # remove all temp files\n", + " os.remove(resample_path)\n", + " os.remove(reclass_file)\n", + " os.remove(geojson_out)\n", + "\n", + " # inundation_per_cls: GeoDataFrame \n", + " return inund_per_cls\n", + "\n", + " else:\n", + " return gpd.GeoDataFrame(data={'value': 1}, index=[0], geometry=[None])\n", + " \n", + " \n", + "def fim_multiple_scenarios(dam_id, input_dir, output_dir):\n", + " \n", + " sce_mh = {'loadCondition': 'MH', 'breachCondition': 'F'} # Maximun Height scenario\n", + " sce_tas = {'loadCondition': 'TAS', 'breachCondition': 'F'} # Top of Active Storage scenario\n", + " sce_nh = {'loadCondition': 'NH', 'breachCondition': 'F'} # Normal Height scenario\n", + "\n", + " # Maximun Height scenario (weight: 1)\n", + " fim_path_mh = f\"{input_dir}/NID_FIM_{sce_mh['loadCondition']}_{sce_mh['breachCondition']}/{sce_mh['loadCondition']}_{sce_mh['breachCondition']}_{dam_id}.tiff\"\n", + " fim_gdf_mh = polygonize_fim(fim_path_mh, output_dir)\n", + " fim_gdf_mh['value_mh'] = fim_gdf_mh['value'] * 1\n", + " fim_gdf_mh.drop(columns=['value'], inplace=True)\n", + "\n", + " # Top of Active Storage scenario (weight: 1)\n", + " fim_path_tas = f\"{input_dir}/NID_FIM_{sce_tas['loadCondition']}_{sce_tas['breachCondition']}/{sce_tas['loadCondition']}_{sce_tas['breachCondition']}_{dam_id}.tiff\"\n", + " fim_gdf_tas = polygonize_fim(fim_path_tas, output_dir)\n", + " fim_gdf_tas['value_tas'] = fim_gdf_tas['value'] * 1\n", + " fim_gdf_tas.drop(columns=['value'], inplace=True)\n", + "\n", + " # Normal Height scenario (weight: 1)\n", + " fim_path_nh = f\"{input_dir}/NID_FIM_{sce_nh['loadCondition']}_{sce_nh['breachCondition']}/{sce_nh['loadCondition']}_{sce_nh['breachCondition']}_{dam_id}.tiff\"\n", + " fim_gdf_nh = polygonize_fim(fim_path_nh, output_dir)\n", + " fim_gdf_nh['value_nh'] = fim_gdf_nh['value'] * 1\n", + " fim_gdf_nh.drop(columns=['value'], inplace=True)\n", + "\n", + " # Find intersections of inundated area across multiple scenarios\n", + " temp_fim_gdf = gpd.overlay(fim_gdf_nh, fim_gdf_tas, how='union')\n", + " fim_gdf = gpd.overlay(temp_fim_gdf, fim_gdf_mh, how='union')\n", + " fim_gdf.fillna(0, inplace=True)\n", + "\n", + " # Sum values (1: MH only, 2: MH + TAS , 3: MH + TAS + NH)\n", + " fim_gdf['value'] = fim_gdf.apply(lambda x:x['value_mh'] + x['value_tas'] + x['value_nh'], axis=1)\n", + " fim_gdf.drop(columns=['value_mh', 'value_tas', 'value_nh'], inplace=True)\n", + " fim_gdf['Dam_ID'] = dam_id\n", + " \n", + " return fim_gdf\n", + "\n", + "\n", + "\n", + "fim_gdf = fim_multiple_scenarios(dam_id, data_dir, output_dir)\n", + "\n", + "# Plot polygonized inundation risk of a dam failure\n", + "color_brewer = ['#9ecae1','#4292c6','#084594']\n", + "cm = LinearSegmentedColormap.from_list('cb_', color_brewer, N=3)\n", + "\n", + "fig, ax = plt.subplots(figsize=(8,8))\n", + "fim_gdf.plot('value', ax=ax, cmap=cm, alpha=0.8)\n", + "cx.add_basemap(ax=ax, source=cx.providers.Stamen.TonerLite, crs=fim_gdf.crs, attribution_size=0, zoom=10) # Add basemap\n", + "\n", + "# Hide coordinates in the plot axes\n", + "ax.get_xaxis().set_visible(False)\n", + "ax.get_yaxis().set_visible(False)\n", + "plt.show()" + ] + }, + { + "cell_type": "markdown", + "id": "34703c75", + "metadata": {}, + "source": [ + "### 1.2. Calculate the highest inundation risk value per census block" + ] + }, + { + "cell_type": "code", + "execution_count": null, + "id": "598a8159", + "metadata": {}, + "outputs": [], + "source": [ + "%%run_remote\n", + "\n", + "# This function returns the id of states that would be impacted by the failure of the dam of interest\n", + "def state_num_related_to_fim(fim_gdf, tract_gdf):\n", + " \n", + " tract_geoms = pygeos.from_shapely(tract_gdf['geometry'].values)\n", + " tract_geoms_tree = pygeos.STRtree(tract_geoms, leafsize=50)\n", + "\n", + " fim_geom_union = pygeos.from_shapely(fim_gdf['geometry'].unary_union) \n", + " query_intersect = tract_geoms_tree.query(fim_geom_union, predicate='intersects')\n", + " tract_gdf = tract_gdf.loc[query_intersect]\n", + "\n", + " tract_gdf['STATE'] = tract_gdf.apply(lambda x:x['GEOID'][0:2], axis=1)\n", + " unique_state = tract_gdf['STATE'].unique()\n", + " \n", + " # return type: list\n", + " return unique_state\n", + "\n", + "# Census tract geometry across the conterminous United States\n", + "tract_gdf = gpd.read_file(os.path.join(data_dir, 'census_geometry', 'census_tract_from_api.geojson'))\n", + "fim_state = state_num_related_to_fim(fim_gdf, tract_gdf)\n", + "\n", + "# Load census block geometry of the selected states\n", + "if len(fim_state) == 1: # If only one state is associated with the inundation mapping\n", + " block_gdf = gpd.read_file(os.path.join(data_dir, 'census_geometry', f'tl_2020_{fim_state[0]}_tabblock20.geojson'))\n", + "elif len(fim_state) >= 2: # If multiple states are associated with the inundation mapping\n", + " block_gdf = pd.DataFrame()\n", + " for state_num in fim_state:\n", + " temp_gdf = gpd.read_file(os.path.join(data_dir, 'census_geometry', f'tl_2020_{state_num}_tabblock20.geojson'))\n", + " block_gdf = pd.concat([temp_gdf, block_gdf]).reset_index(drop=True)\n", + " block_gdf = gpd.GeoDataFrame(block_gdf, geometry=block_gdf['geometry'], crs=\"EPSG:4326\")\n", + "else:\n", + " raise AttributeError('NO STATE is related to Inundation Mapping')\n", + "\n", + "# Destination dataframe to save the results\n", + "fim_geoid_gdf = gpd.GeoDataFrame({'Dam_ID': pd.Series(dtype='str'),\n", + " 'GEOID': pd.Series(dtype='str'),\n", + " 'Class': pd.Series(dtype='str')\n", + " }\n", + " ) \n", + "\n", + "# Create STRtree for block_gdf\n", + "block_geoms = pygeos.from_shapely(block_gdf['geometry'].values)\n", + "block_geoms_tree = pygeos.STRtree(block_geoms, leafsize=50)\n", + "\n", + "# Extract census tract intersecting with each class of inundation map\n", + "for water_cls in fim_gdf['value'].unique():\n", + " fim_geom_ = pygeos.from_shapely(fim_gdf.loc[fim_gdf['value'] == water_cls, 'geometry'].unary_union)\n", + " query_fim_geom_ = block_geoms_tree.query(fim_geom_, predicate='intersects')\n", + " fim_geoid_ = block_gdf.loc[query_fim_geom_]\n", + " fim_geoid_['Class'] = water_cls\n", + " fim_geoid_['Dam_ID'] = dam_id\n", + " \n", + " fim_geoid_gdf = pd.concat([fim_geoid_, fim_geoid_gdf]).reset_index(drop=True)\n", + "\n", + "# Cleaning output\n", + "fim_geoid_gdf = fim_geoid_gdf[['GEOID', 'Dam_ID', 'Class', 'geometry']]\n", + "\n", + "# Find the highest inundation risk per census block\n", + "fim_geoid_gdf = fim_geoid_gdf.groupby(['Dam_ID', 'GEOID'], \n", + " group_keys=False).apply(lambda x:x.loc[x['Class'].idxmax()]\n", + " ).reset_index(drop=True)\n", + "fim_geoid_gdf = fim_geoid_gdf.set_crs(epsg=4326)\n", + "fim_geoid_gdf" + ] + }, + { + "cell_type": "markdown", + "id": "9591cac6", + "metadata": {}, + "source": [ + "### 1.3. Step 1 results (Inundation risk per census block)" + ] + }, + { + "cell_type": "code", + "execution_count": null, + "id": "50dcf54e", + "metadata": {}, + "outputs": [], + "source": [ + "%%run_remote\n", + "\n", + "# Plot census block with inundation risk of a dam failure\n", + "color_brewer = ['#9ecae1','#4292c6','#084594']\n", + "cm = LinearSegmentedColormap.from_list('cb_', color_brewer, N=3)\n", + "\n", + "fig, ax = plt.subplots(figsize=(8,8))\n", + "fim_geoid_gdf.plot('Class', ax=ax, cmap=cm, alpha=0.8)\n", + "cx.add_basemap(ax=ax, source=cx.providers.Stamen.TonerLite, crs=fim_gdf.crs, attribution_size=0, zoom=10)\n", + "ax.get_xaxis().set_visible(False)\n", + "ax.get_yaxis().set_visible(False)\n", + "plt.show()" + ] + }, + { + "cell_type": "markdown", + "id": "e990bd22", + "metadata": {}, + "source": [ + "## 2. Retrive Census Data\n", + "\n", + "To investigate the social vulnerability of the population at-risk of dam failure, we retrieve the following variables from Census API.\n", + "\n", + "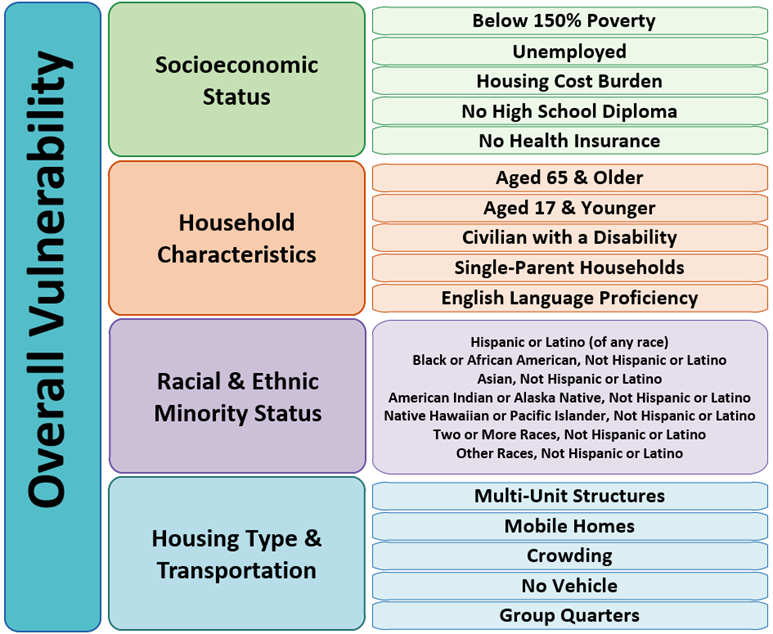\n", + "\n", + "Source: https://www.atsdr.cdc.gov/placeandhealth/svi/documentation/SVI_documentation_2020.html"; + ] + }, + { + "cell_type": "code", + "execution_count": null, + "id": "43f9fb48", + "metadata": {}, + "outputs": [], + "source": [ + "%%run_remote\n", + "\n", + "def call_census_table(state_list, table_name, key):\n", + " \n", + " result_df = pd.DataFrame()\n", + " \n", + " # querying at census tract level\n", + " for state in state_list:\n", + " if table_name.startswith('DP'):\n", + " address = f'https://api.census.gov/data/2020/acs/acs5/profile?get=NAME,{table_name}&for=tract:*&in=state:{state}&in=county:*'\n", + " elif table_name.startswith('S'):\n", + " address = f'https://api.census.gov/data/2020/acs/acs5/subject?get=NAME,{table_name}&for=tract:*&in=state:{state}&in=county:*'\n", + " elif table_name.startswith('B'):\n", + " address = f'https://api.census.gov/data/2020/acs/acs5?get=NAME,{table_name}&for=tract:*&in=state:{state}&in=county:*'\n", + " else:\n", + " raise AttributeError('Proper Table Name Is Needed.')\n", + " \n", + " response = requests.get(f'{address}&key={key}').json()\n", + " result_ = pd.DataFrame(response)\n", + " \n", + " result_.columns = response[0]\n", + " result_.drop(0, axis=0, inplace=True)\n", + " \n", + " result_df = pd.concat([result_, result_df]).reset_index(drop=True)\n", + " \n", + " # result_df = result_df.rename(columns={'GEO_ID':'GEOID_T'})\n", + " result_df['GEOID_T'] = result_df.apply(lambda x: x['state'] + x['county'] + x['tract'], axis=1)\n", + " result_df[table_name] = result_df[table_name].astype(float)\n", + " \n", + " return result_df[['GEOID_T', table_name]]\n", + "\n", + "\n", + "# Employed census tables to calculate each social vulnerabilty related variables.\n", + "# str: single variable\n", + "# list: [[To be summed and set as numerator], demonimator] \n", + "census_info = {\n", + " \"EP_POV150\" : [['S1701_C01_040E'], 'S1701_C01_001E'],\n", + " \"EP_UNEMP\" : 'DP03_0009PE',\n", + " \"EP_HBURD\" : [['S2503_C01_028E', 'S2503_C01_032E', 'S2503_C01_036E', 'S2503_C01_040E'], \n", + " 'S2503_C01_001E'],\n", + " \"EP_NOHSDP\" : 'S0601_C01_033E',\n", + " \"EP_UNINSUR\" : 'S2701_C05_001E',\n", + " \"EP_AGE65\" : 'S0101_C02_030E',\n", + " \"EP_AGE17\" : [['B09001_001E'], \n", + " 'S0601_C01_001E'],\n", + " \"EP_DISABL\" : 'DP02_0072PE',\n", + " \"EP_SNGPNT\" : [['B11012_010E', 'B11012_015E'], 'DP02_0001E'],\n", + " \"EP_LIMENG\" : [['B16005_007E', 'B16005_008E', 'B16005_012E', 'B16005_013E', 'B16005_017E', 'B16005_018E', \n", + " 'B16005_022E', 'B16005_023E', 'B16005_029E', 'B16005_030E', 'B16005_034E', 'B16005_035E',\n", + " 'B16005_039E', 'B16005_040E', 'B16005_044E', 'B16005_045E'], \n", + " 'B16005_001E'],\n", + " \"EP_MINRTY\" : [['DP05_0071E', 'DP05_0078E', 'DP05_0079E', 'DP05_0080E', \n", + " 'DP05_0081E', 'DP05_0082E', 'DP05_0083E'],\n", + " 'S0601_C01_001E'],\n", + " \"EP_MUNIT\" : [['DP04_0012E', 'DP04_0013E'], \n", + " 'DP04_0001E'],\n", + " \"EP_MOBILE\" : 'DP04_0014PE',\n", + " \"EP_CROWD\" : [['DP04_0078E', 'DP04_0079E'], \n", + " 'DP04_0002E'],\n", + " \"EP_NOVEH\" : 'DP04_0058PE',\n", + " \"EP_GROUPQ\": [['B26001_001E'], \n", + " 'S0601_C01_001E']\n", + "}\n", + "\n", + "\n", + "# Calculate GEOID for census tract as the census data is provided based on census tract\n", + "fim_geoid_gdf['GEOID_T'] = fim_geoid_gdf.apply(lambda x:x['GEOID'][0:11], axis=1)\n", + "\n", + "# List of states that is associated with the dam failure\n", + "state_list = fim_geoid_gdf.apply(lambda x:x['GEOID'][0:2], axis=1).unique()\n", + "\n", + "cols = list(census_info.keys())\n", + "cols.append('GEOID_T')\n", + "\n", + "'''\n", + "This commented cell demonstrates how the census data was retrieved from the Census API.\n", + "To avoid potential issue during the API calling, this demonstration loads `census_data.csv`,\n", + "which is already retrieved and stored in the repo. \n", + "\n", + "attr_df = pd.DataFrame({'GEOID_T':fim_geoid_gdf['GEOID_T'].unique().tolist()})\n", + "for attr in census_info.keys(): # attr: svi-related census abbriviation on the final table\n", + " print(f'Retrieving {attr} from Census API')\n", + " \n", + " if type(census_info[attr]) == str:\n", + " temp_table = call_census_table(state_list, census_info[attr], API_Key)\n", + " attr_df = attr_df.merge(temp_table, on='GEOID_T')\n", + " attr_df = attr_df.rename(columns={census_info[attr]: attr})\n", + " else:\n", + " for table in census_info[attr][0]: # Retrieve numerator variables\n", + " temp_table = call_census_table(state_list, table, API_Key)\n", + " attr_df = attr_df.merge(temp_table, on='GEOID_T')\n", + "\n", + " temp_table = call_census_table(state_list, census_info[attr][1], API_Key) # Retrieve denominator variable\n", + " attr_df = attr_df.merge(temp_table, on='GEOID_T')\n", + "\n", + " # Calculate the ratio of each variable\n", + " attr_df[attr] = attr_df[census_info[attr][0]].sum(axis=1) / attr_df[census_info[attr][1]] * 100\n", + "\n", + " # Remove intermediate columns used for SVI related census calculation\n", + " attr_df = attr_df[attr_df.columns.intersection(cols)]\n", + "\n", + " # Replace not valid value (e.g., -666666) from census with nan value\n", + " attr_df[attr] = attr_df.apply(lambda x: float('nan') if x[attr] < 0 else x[attr], axis=1)\n", + "'''\n", + "\n", + "# Merge census data with fim_geoid_gdf\n", + "attr_df = pd.read_csv(os.path.join(data_dir, 'census_geometry', 'census_data.csv')) \n", + "attr_df['GEOID_T'] = attr_df['GEOID_T'].astype(str)\n", + "attr_df['GEOID_T'] = attr_df.apply(lambda x:x['GEOID_T'].zfill(11), axis=1)\n", + "fim_geoid_gdf = fim_geoid_gdf.merge(attr_df, on='GEOID_T')\n", + "\n", + "# Reproject fim_geoid to EPSG:5070, NAD83 / Conus Albers (meters)\n", + "fim_geoid_gdf = fim_geoid_gdf.to_crs(epsg=5070)\n", + "fim_geoid_gdf.head(3)\n" + ] + }, + { + "cell_type": "code", + "execution_count": null, + "id": "7be1b230", + "metadata": {}, + "outputs": [], + "source": [ + "%%run_remote\n", + "\n", + "# Plot an example of census variable (POV150: Below 150% Poverty)\n", + "fig, ax = plt.subplots(figsize=(8,8))\n", + "\n", + "fim_geoid_gdf.plot('EP_POV150', ax=ax, scheme='naturalbreaks', cmap='Reds', legend=True)\n", + "cx.add_basemap(ax=ax, source=cx.providers.Stamen.TonerLite, crs=fim_geoid_gdf.crs, attribution_size=0, zoom=10)\n", + "ax.get_xaxis().set_visible(False)\n", + "ax.get_yaxis().set_visible(False)\n", + "plt.show()" + ] + }, + { + "cell_type": "markdown", + "id": "aac41f7e", + "metadata": {}, + "source": [ + "## 3. Relationship between social vulnerabilty of population and inundation risk of dam failure\n", + "\n", + "Based on two well-known metrics (Bivariate Moran’s I and Bivariate Local Indicator of Spatial Association (LISA)) spatial correlation step investigates the relationship between the inundation risk and social vulnerability of each census variable at the census block level. Each metric takes two input variables: 1) the potential risk of dam failure-induced flooding and 2) one out of 16 census data related to social vulnerability. Here, we employed the Queen’s case as spatial contiguit [...] + ] + }, + { + "cell_type": "code", + "execution_count": null, + "id": "ffeb00a7", + "metadata": {}, + "outputs": [], + "source": [ + "%%run_remote\n", + "\n", + "def calculate_bivariate_Moran_I_and_LISA(dam_id, census_dic, fim_geoid_gdf, dams_gdf):\n", + "\n", + " input_cols = list(census_dic.keys())\n", + " input_cols.extend(['Dam_ID', 'GEOID', 'Class', 'geometry'])\n", + " fim_geoid_local = fim_geoid_gdf.loc[fim_geoid_gdf['Dam_ID'] == dam_id, input_cols].reset_index(drop=True)\n", + " dam_local = dams_gdf.loc[dams_gdf['ID'] == dam_id].reset_index(drop=True)\n", + "\n", + " # Iterate through all census variables\n", + " for census_name in census_dic.keys():\n", + " new_col_name = census_name.split(\"_\")[1]\n", + " \n", + " # Remove invalid values of census data for local fim_geoid \n", + " fim_geoid_local_var = fim_geoid_local.loc[(~fim_geoid_local[census_name].isna()) & (fim_geoid_local[census_name] >= 0), \n", + " ['Dam_ID', 'GEOID', 'Class', census_name, 'geometry']].reset_index(drop=True)\n", + " \n", + " # Calculate Bivaraite Moran's I & Local Moran's I with Queen's Case Contiguity\n", + " w = libpysal.weights.Queen.from_dataframe(fim_geoid_local_var) # Adjacency matrix (Queen case)\n", + " bv_mi = esda.Moran_BV(fim_geoid_local_var['Class'], fim_geoid_local_var[census_name], w) \n", + " bv_lm = esda.Moran_Local_BV(fim_geoid_local_var['Class'], fim_geoid_local_var[census_name], w, seed=17)\n", + "\n", + " # Enter results of Bivariate LISA into each census region\n", + " lm_dict = {1: 'HH', 2: 'LH', 3: 'LL', 4: 'HL'}\n", + " for idx in range(fim_geoid_local_var.shape[0]):\n", + " if bv_lm.p_sim[idx] < 0.05:\n", + " fim_geoid_local_var.loc[idx, f'LISA_{new_col_name}'] = lm_dict[bv_lm.q[idx]]\n", + " else:\n", + " fim_geoid_local_var.loc[idx, f'LISA_{new_col_name}'] = 'Not_Sig'\n", + "\n", + " fim_geoid_local_na = fim_geoid_local.loc[fim_geoid_local[census_name].isna(), ['Dam_ID', 'GEOID', 'Class', census_name, 'geometry']]\n", + " fim_geoid_local_na[f'LISA_{new_col_name}'] = 'NA'\n", + " fim_geoid_local_var = pd.concat([fim_geoid_local_var, fim_geoid_local_na]).reset_index(drop=True) \n", + " fim_geoid_local = fim_geoid_local.merge(fim_geoid_local_var[['GEOID', f'LISA_{new_col_name}']], on='GEOID')\n", + "\n", + " # Enter Bivariate Moran's I result into each dam\n", + " dam_local[f'MI_{new_col_name}'] = bv_mi.I\n", + " dam_local[f'pval_{new_col_name}'] = bv_mi.p_z_sim\n", + " \n", + " return dam_local, fim_geoid_local\n", + "\n", + "# Calculates Bivariate Moran's I (mi) and Bivariate LISA (lm)\n", + "mi, lm = calculate_bivariate_Moran_I_and_LISA(dam_id, census_info, fim_geoid_gdf, fed_dams)\n", + "lm.head(3)" + ] + }, + { + "cell_type": "code", + "execution_count": null, + "id": "29f7f34b", + "metadata": {}, + "outputs": [], + "source": [ + "%%run_remote\n", + "\n", + "# Plot Inundation Risk\n", + "color_brewer = ['#9ecae1','#4292c6','#084594']\n", + "cm = LinearSegmentedColormap.from_list('cb_', color_brewer, N=3)\n", + "\n", + "fig, ax = plt.subplots(figsize=(8,8))\n", + "lm.plot('Class', ax=ax, cmap=cm, alpha=0.8)\n", + "mi_plot = mi.to_crs(epsg=5070)\n", + "mi_plot.plot(marker=\"*\", color='red', markersize=200, ax=ax)\n", + "cx.add_basemap(ax=ax, source=cx.providers.Stamen.TonerLite, crs=lm.crs, attribution_size=0, zoom=10)\n", + "ax.set_title('Inundation Risk', fontsize=18)\n", + "ax.get_xaxis().set_visible(False)\n", + "ax.get_yaxis().set_visible(False)\n", + "plt.show()" + ] + }, + { + "cell_type": "code", + "execution_count": null, + "id": "510c853f", + "metadata": {}, + "outputs": [], + "source": [ + "%%run_remote\n", + "\n", + "# Plot Bivariate LISA\n", + "'''\n", + "# The title of each cell provides Bivariate Moran's I \n", + "# Census block color codes:\n", + "## Red: HH cluster (high inundation risk and high social vulnerability)\n", + "## Skyblue: HL cluster (high inundation risk and low social vulnerability)\n", + "## Orange: LH cluster (low inundation risk and high social vulnerability)\n", + "## Blue: LL cluster (low inundation risk and low social vulnerability)\n", + "'''\n", + "plot_cols = [ col.split('_')[1] for col in census_info.keys()]\n", + "\n", + "# LISA\n", + "fig, axes = plt.subplots(4, 4, figsize=(15, 15))\n", + "axes = axes.reshape(-1)\n", + "\n", + "lisa_color = {'HH': 'red', 'LL': 'blue', 'HL': 'skyblue', 'LH': 'orange', 'Not_Sig': 'white'}\n", + "boundary_gdf = gpd.GeoDataFrame([0], geometry=[lm.unary_union])\n", + "\n", + "for idx, val in enumerate(plot_cols):\n", + " for key in lisa_color.keys():\n", + " lm.loc[(lm[f'LISA_{val}'] == key)].plot(ax=axes[idx], color=lisa_color[key], edgecolor='face', lw=0.3, legend=True)\n", + "\n", + " boundary_gdf.boundary.plot(ax=axes[idx], lw=0.5, color='black')\n", + " axes[idx].set_title(label=f\"{val}\\n(BV Moran's I: {round(mi_plot.loc[mi_plot['ID'] == dam_id, f'MI_{val}'].values[0], 2)})\",\n", + " fontsize=18)\n", + " mi_plot.plot(marker=\"*\", color='black', markersize=400, ax=axes[idx])\n", + "\n", + " axes[idx].get_xaxis().set_visible(False)\n", + " axes[idx].get_yaxis().set_visible(False)\n", + "\n", + "plt.tight_layout()\n", + "plt.show()" + ] + }, + { + "cell_type": "markdown", + "id": "d3a8e506", + "metadata": {}, + "source": [ + "# Done" + ] + } + ], + "metadata": { + "kernelspec": { + "display_name": "Python 3 (ipykernel)", + "language": "python", + "name": "python3" + }, + "language_info": { + "codemirror_mode": { + "name": "ipython", + "version": 3 + }, + "file_extension": ".py", + "mimetype": "text/x-python", + "name": "python", + "nbconvert_exporter": "python", + "pygments_lexer": "ipython3", + "version": "3.12.9" + } + }, + "nbformat": 4, + "nbformat_minor": 5 +} diff --git a/modules/agent-framework/airavata-agent/jupyter/data.tar.gz b/modules/agent-framework/airavata-agent/jupyter/data.tar.gz new file mode 100644 index 0000000000..f0fd67ef2e Binary files /dev/null and b/modules/agent-framework/airavata-agent/jupyter/data.tar.gz differ diff --git a/modules/agent-framework/airavata-agent/jupyter/labconfig/airavata_magics.py b/modules/agent-framework/airavata-agent/jupyter/labconfig/airavata_magics.py index 6d0708f6c5..cd120a554f 100644 --- a/modules/agent-framework/airavata-agent/jupyter/labconfig/airavata_magics.py +++ b/modules/agent-framework/airavata-agent/jupyter/labconfig/airavata_magics.py @@ -66,7 +66,7 @@ def get_process_id(experiment_id: str, headers) -> str: return process_id -def submit_agent_job(experiment_name, cluster, queue, cpus, memory, walltime, access_token, gateway_id='default', group='Default'): +def submit_agent_job(experiment_name, cluster, queue, cpus, memory, walltime, access_token, group, gateway_id='default'): global current_agent # URL to which the POST request will be sent @@ -80,7 +80,8 @@ def submit_agent_job(experiment_name, cluster, queue, cpus, memory, walltime, ac 'nodeCount': 1, 'memory': memory, 'wallTime': walltime, - 'queue': queue + 'queue': queue, + 'group': group, } # Convert the data to JSON format @@ -307,6 +308,7 @@ def init_remote(line): cpu_value = None queue_value = None walltime_value = None + group_value = "" # Iterate through the pairs to find the cluster value for pair in pairs: @@ -320,8 +322,10 @@ def init_remote(line): queue_value = pair.split("=")[1] if pair.startswith("walltime="): walltime_value = pair.split("=")[1] + if pair.startswith("group="): + group_value = pair.split("=")[1] - submit_agent_job('CS_Agent', cluster_value, queue_value, cpu_value, memory_value, walltime_value, access_token) + submit_agent_job('CS_Agent', cluster_value, queue_value, cpu_value, memory_value, walltime_value, access_token, group_value) @register_line_magic diff --git a/modules/agent-framework/airavata-agent/jupyter/labconfig/bootstrap.sh b/modules/agent-framework/airavata-agent/jupyter/labconfig/bootstrap.sh index 754a6e8f52..b4ae3f6ed5 100644 --- a/modules/agent-framework/airavata-agent/jupyter/labconfig/bootstrap.sh +++ b/modules/agent-framework/airavata-agent/jupyter/labconfig/bootstrap.sh @@ -1,2 +1 @@ -cd /home/jupyter-notebook-examples && git pull && cd - jupyter lab --config=/jupyter_lab_config.py --ip=0.0.0.0 --port=8888 --no-browser --allow-root --NotebookApp.token='' \ No newline at end of file