Leesson opened a new issue #12030: dataZoom在X轴为time类型的曲线图展示错误 URL: https://github.com/apache/incubator-echarts/issues/12030 ### Version 4.6.0 ### Steps to reproduce https://codepen.io/Leesson/pen/rNaKLXm ### What is expected? dataZoom中数据分布与表中曲线保持一致,按照时间分布。而不是根据传入的data数量平均分布 ### What is actually happening? dataZoom的数据分布和曲线图不一致,不是按照时间分布。看效果像是dataZoom将传入的data根据数量平均分布在X方向,导致数据和时间不对应。曲线图后边没有数据的部分占据了X轴将近二分之一,但在dataZoom中只占据了很短一段(dataZoom中value和时间的对应关系错误) 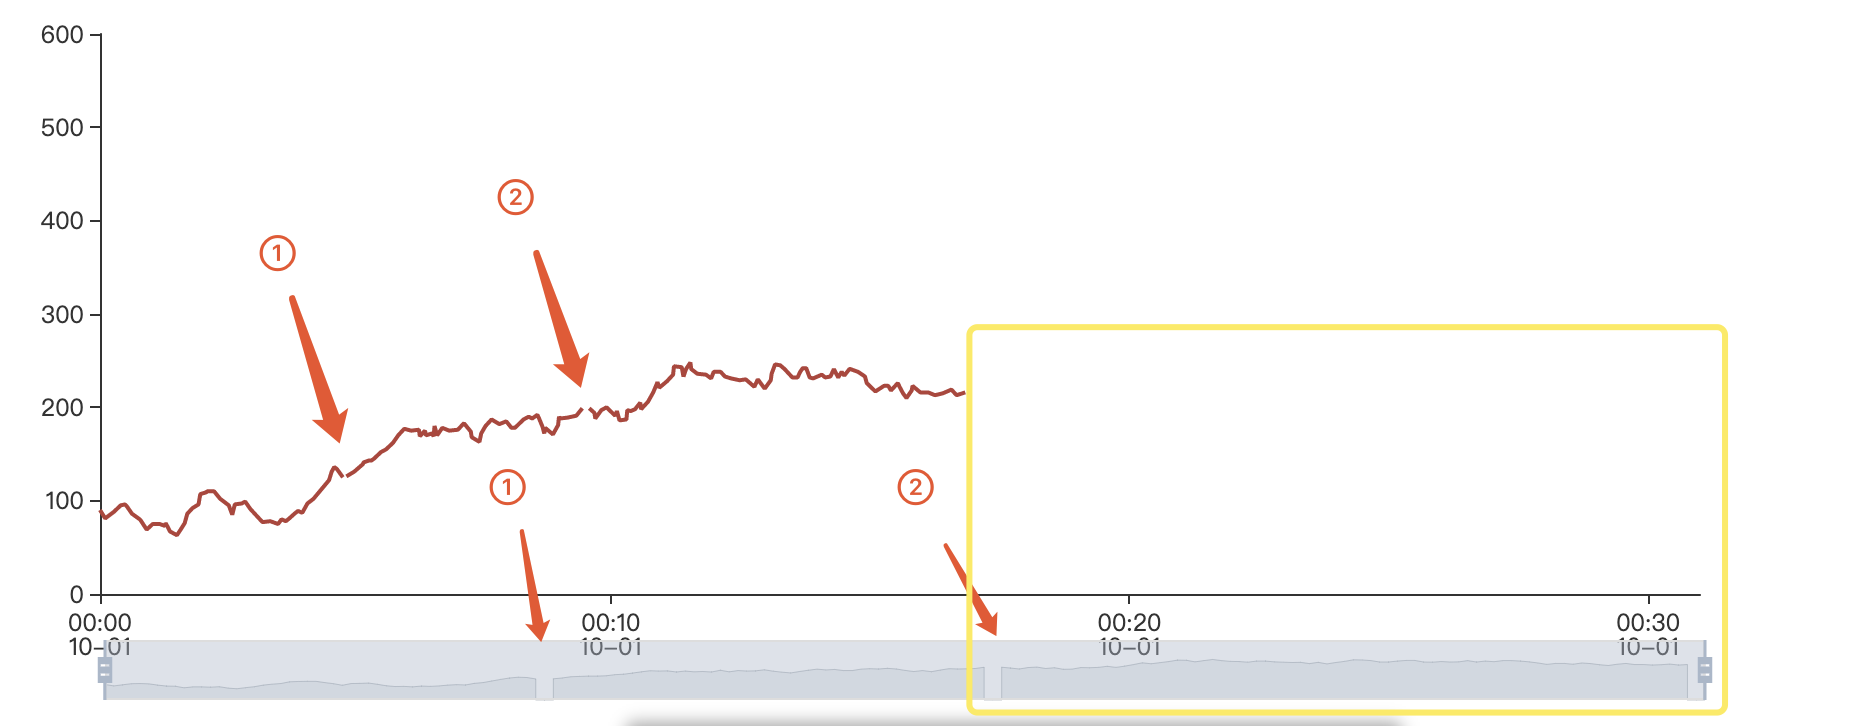 <!-- This issue is generated by echarts-issue-helper. DO NOT REMOVE -->
----------------------------------------------------------------
This is an automated message from the Apache Git Service.
To respond to the message, please log on to GitHub and use the
URL above to go to the specific comment.

For queries about this service, please contact Infrastructure at:
[email protected]


With regards,
Apache Git Services

---------------------------------------------------------------------
To unsubscribe, e-mail: [email protected]
For additional commands, e-mail: [email protected]

