shishir28 opened a new issue #12239: split markline for series URL: https://github.com/apache/incubator-echarts/issues/12239 ### What problem does this feature solve? Hi , We are food data company . Our hardware device is put into pallet of food like fruits and move along with it during its journey from farm to retail store. During the whole process our device capture temperate, location (Lat/Lon) and time and through software we plot a chart. Through out this journey food are supposed to be in certain temperature range. This is where we want to use your chart component and render the information . As of now we have been assuming the any food will have same min and max temperature range so current 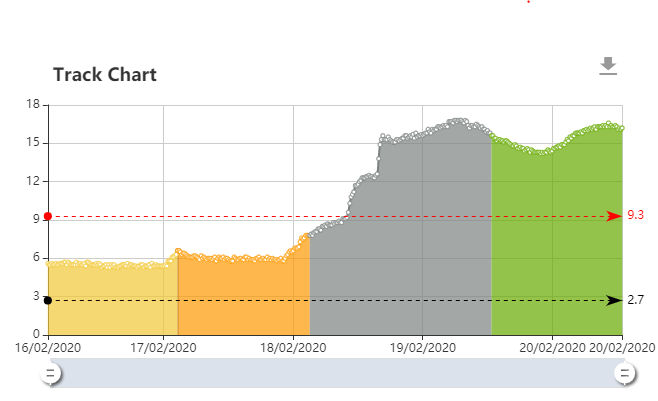 But looks like that is not the case Min and Max temperature range could vary depending where it is something like this (Doing in MS Power BI) 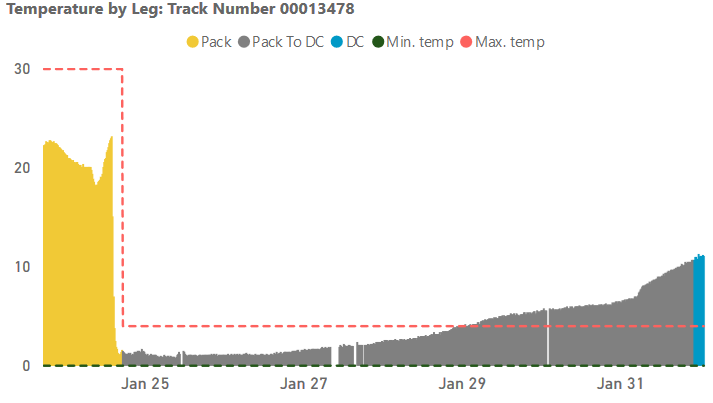 We want markline should end within series (not for whole chart area) . I tried to explore mixing step series with current line but could not do it. I could not find any pointer how to keep markLine within series a . Current code is something like : `` seriesData.push({ type: 'line', markLine: { data: [ { yAxis: graph.TempThreshold.MaxTemp, name: 'Max Temp', lineStyle: { color: 'red' } }, { yAxis: graph.TempThreshold.MinTemp, name: 'Min Temp', lineStyle: { color: 'black' } } ] } }); getLegData(graph).forEach(function (data) { data.points.sort(); seriesData.push({ name: 'Temperature (°C)', type: 'line', smooth: true, areaStyle: { type: 'default' }, data: data.points, color: data.leg.HexColour }); }); `` What I am playing with : `` categorizedData.forEach(function (data) { data.points.sort(); seriesData.push({ name: 'Temperature (°C)', type: 'line', smooth: true, areaStyle: { type: 'default' }, data: data.points, color: data.leg.HexColour, markLine: { symbol: ['none', 'none'], data: [ { yAxis: data.tempBand.MaxTemp,name: 'Max Temp',lineStyle: { color: 'red' } }, { yAxis: data.tempBand.MinTemp ,name: 'Min Temp',lineStyle: { color: 'black' }} ] } }); }); `` But it renders like 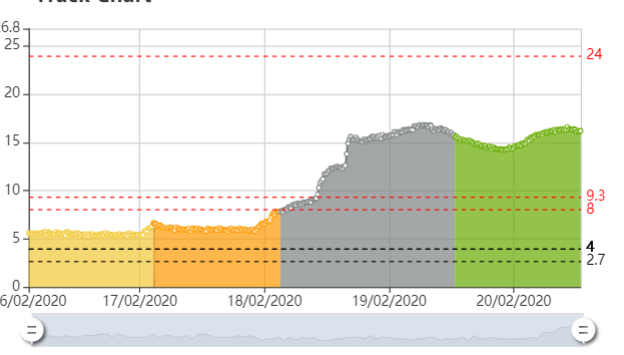 I was wondering if you could provide some pointers so that I can keep marklines in series . Thanks Shishir ### What does the proposed API look like? Non API <!-- This issue is generated by echarts-issue-helper. DO NOT REMOVE --> <!-- This issue is in English. DO NOT REMOVE -->
----------------------------------------------------------------
This is an automated message from the Apache Git Service.
To respond to the message, please log on to GitHub and use the
URL above to go to the specific comment.

For queries about this service, please contact Infrastructure at:
[email protected]


With regards,
Apache Git Services

---------------------------------------------------------------------
To unsubscribe, e-mail: [email protected]
For additional commands, e-mail: [email protected]