100pah commented on issue #12229: Crashing Safari and reload page URL: https://github.com/apache/incubator-echarts/issues/12229#issuecomment-596005138 It is probably a Safari issue: When both using gradient color and shadow to in HTML Canvas rendering at the first time, the memory will increase to over 1GB instantly, which might crash the Safari. I'm not sure how to avoid this defect yet. Need to investigate for a while. But, @qipkiller , to temporarily avoid this issue, please do not use **gradient color** and **shadow** at the same time. That is, in your demo, do not use `echarts.graphic.LinearGradient` and `shadowColor`/`shadowBlue` at the same time. Other info: I have simplified it to a minimal case for this issue: ```html <!DOCTYPE html> <html> <head> <meta charset="utf-8"> <meta name="viewport" content="width=device-width, initial-scale=1" /> <script src="https://cdn.jsdelivr.net/npm/[email protected]/dist/echarts.min.js";></script> </head> <body> <style> .title { font-size: 18px; padding: 5px; } .strong { color:red; } </style> <div class="title"> 1. Open the page in <span class="strong">Safari</span>.</h2><br> 2. Open Safari web inspector - Timeline panel. Start record. Watch "Memory" timeline.<br> 3. Click "Add Data" button. Check whether memory timeline appears a peak <span class="strong">over 1G MB</span>. <br> </div> <button id="addData">Add Data</button> <br> <br> <div id="main0" style="width: 700px; height: 270px;"></div> <script type="text/javascript"> var FIXED_IDX = -1; var xAxisDataRaw = ['05:15:43', '05:15:46', '05:15:48']; var seriesDataRaw0 = [3547546, 3903750, 1628242]; var seriesDataRaw1 = [-167033, -2092606, -1622461]; var xAxisData = ['05:15:41']; var seriesData0 = [0]; var seriesData1 = [0]; init(echarts); function init(echarts) { var option = { legend: {}, xAxis: [{ data: xAxisData }], yAxis: {}, series: [{ name: 'A', type: 'line', areaStyle: { color: { type: 'linear', x: 0, y: 0, x2: 0, y2: 1, colorStops: [{offset: 0, color: 'green'}, {offset: 1, color: 'yellow'}], global: false }, shadowColor: 'green', shadowBlur: 10 }, data: seriesData0 }, { name: 'B', type: 'line', areaStyle: { color: { type: 'linear', x: 0, y: 0, x2: 0, y2: 1, colorStops: [{offset: 0, color: 'green'}, {offset: 1, color: 'yellow'}], global: false }, shadowColor: 'green', shadowBlur: 10 }, data: seriesData1 }] }; function addData() { FIXED_IDX++; if (FIXED_IDX >= xAxisDataRaw.length) { return; } xAxisData.push(xAxisDataRaw[FIXED_IDX]); seriesData0.push(seriesDataRaw0[FIXED_IDX]); seriesData1.push(seriesDataRaw1[FIXED_IDX]); chart.setOption({ xAxis: { data: xAxisData }, series: [{ data: seriesData0 }, { data: seriesData1 }] }); } var chart = echarts.init(document.getElementById('main0')); chart.setOption(option); document.getElementById('addData').onclick = function () { addData(); }; } </script> </body> </html> ``` And the record of the memory timeline: 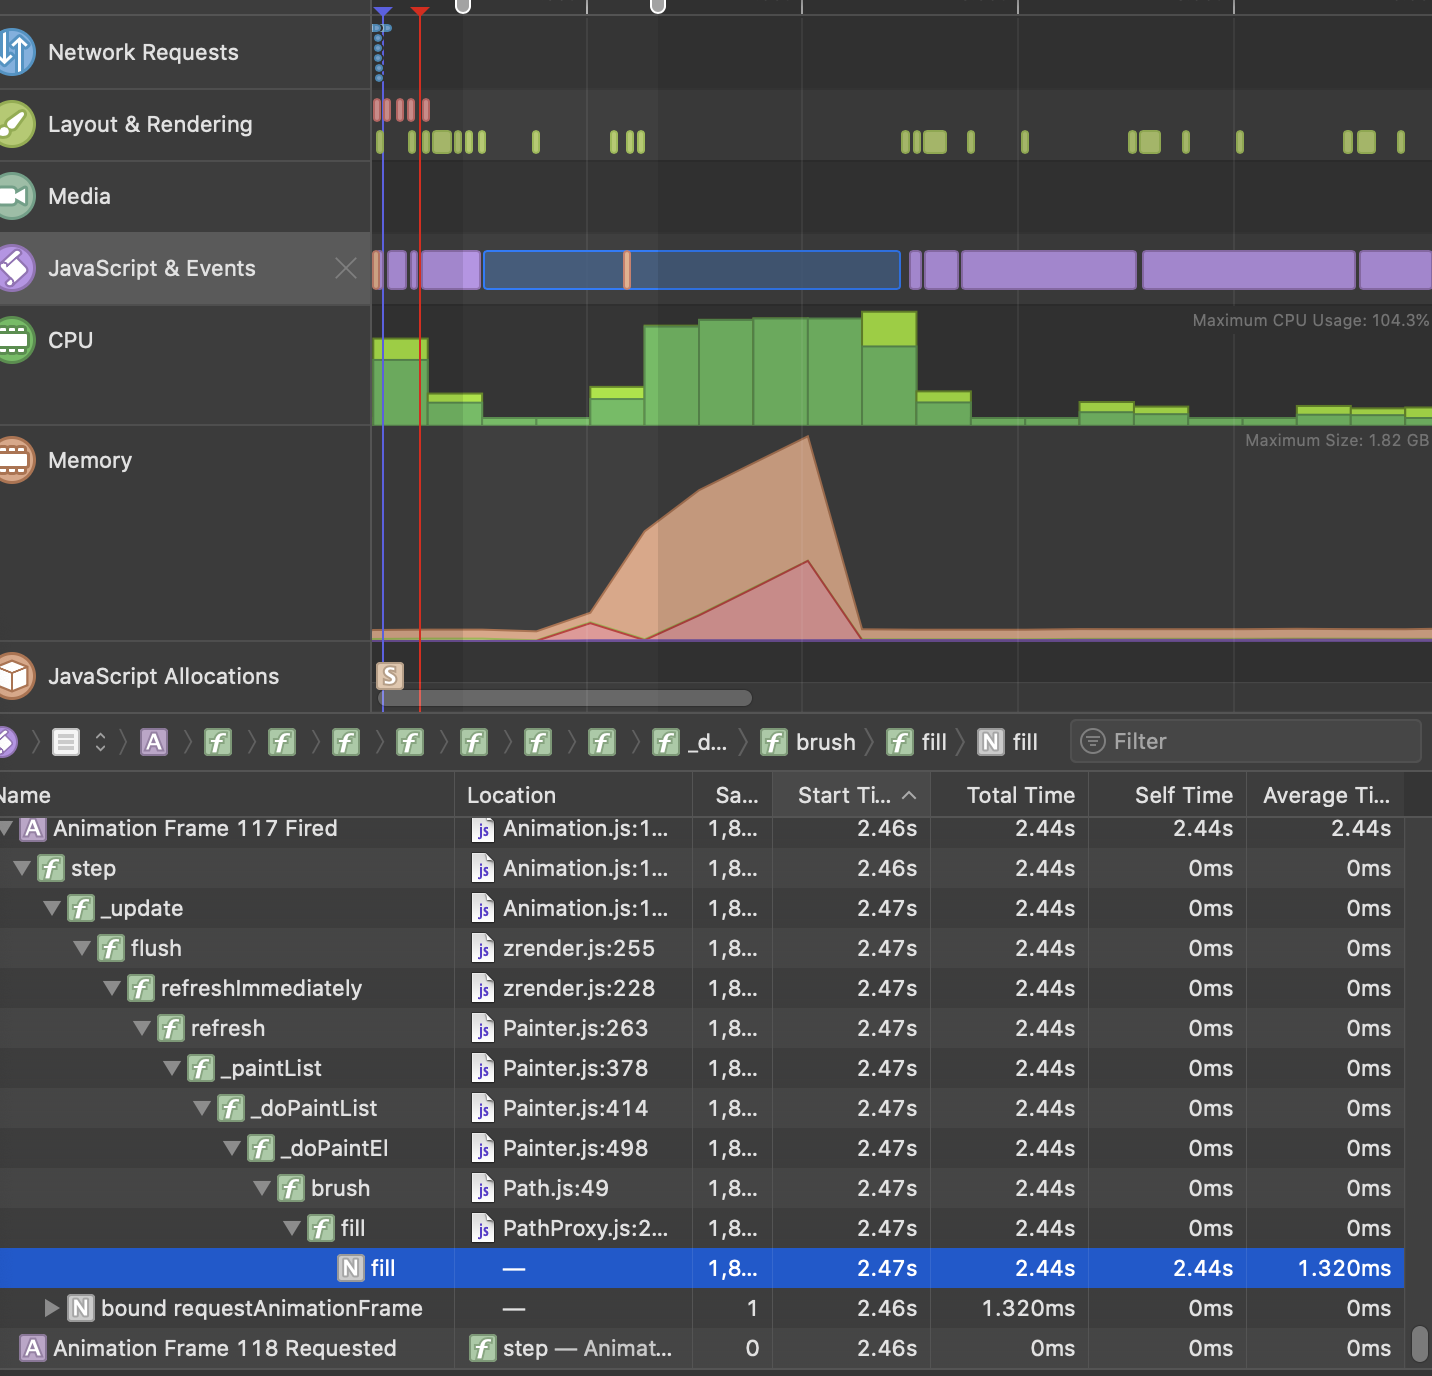 Notice picture above that the memory is over 1GB and the single JS task takes over 2 second.
----------------------------------------------------------------
This is an automated message from the Apache Git Service.
To respond to the message, please log on to GitHub and use the
URL above to go to the specific comment.

For queries about this service, please contact Infrastructure at:
[email protected]


With regards,
Apache Git Services

---------------------------------------------------------------------
To unsubscribe, e-mail: [email protected]
For additional commands, e-mail: [email protected]