plainheart commented on issue #12539:
URL:
https://github.com/apache/incubator-echarts/issues/12539#issuecomment-623240560
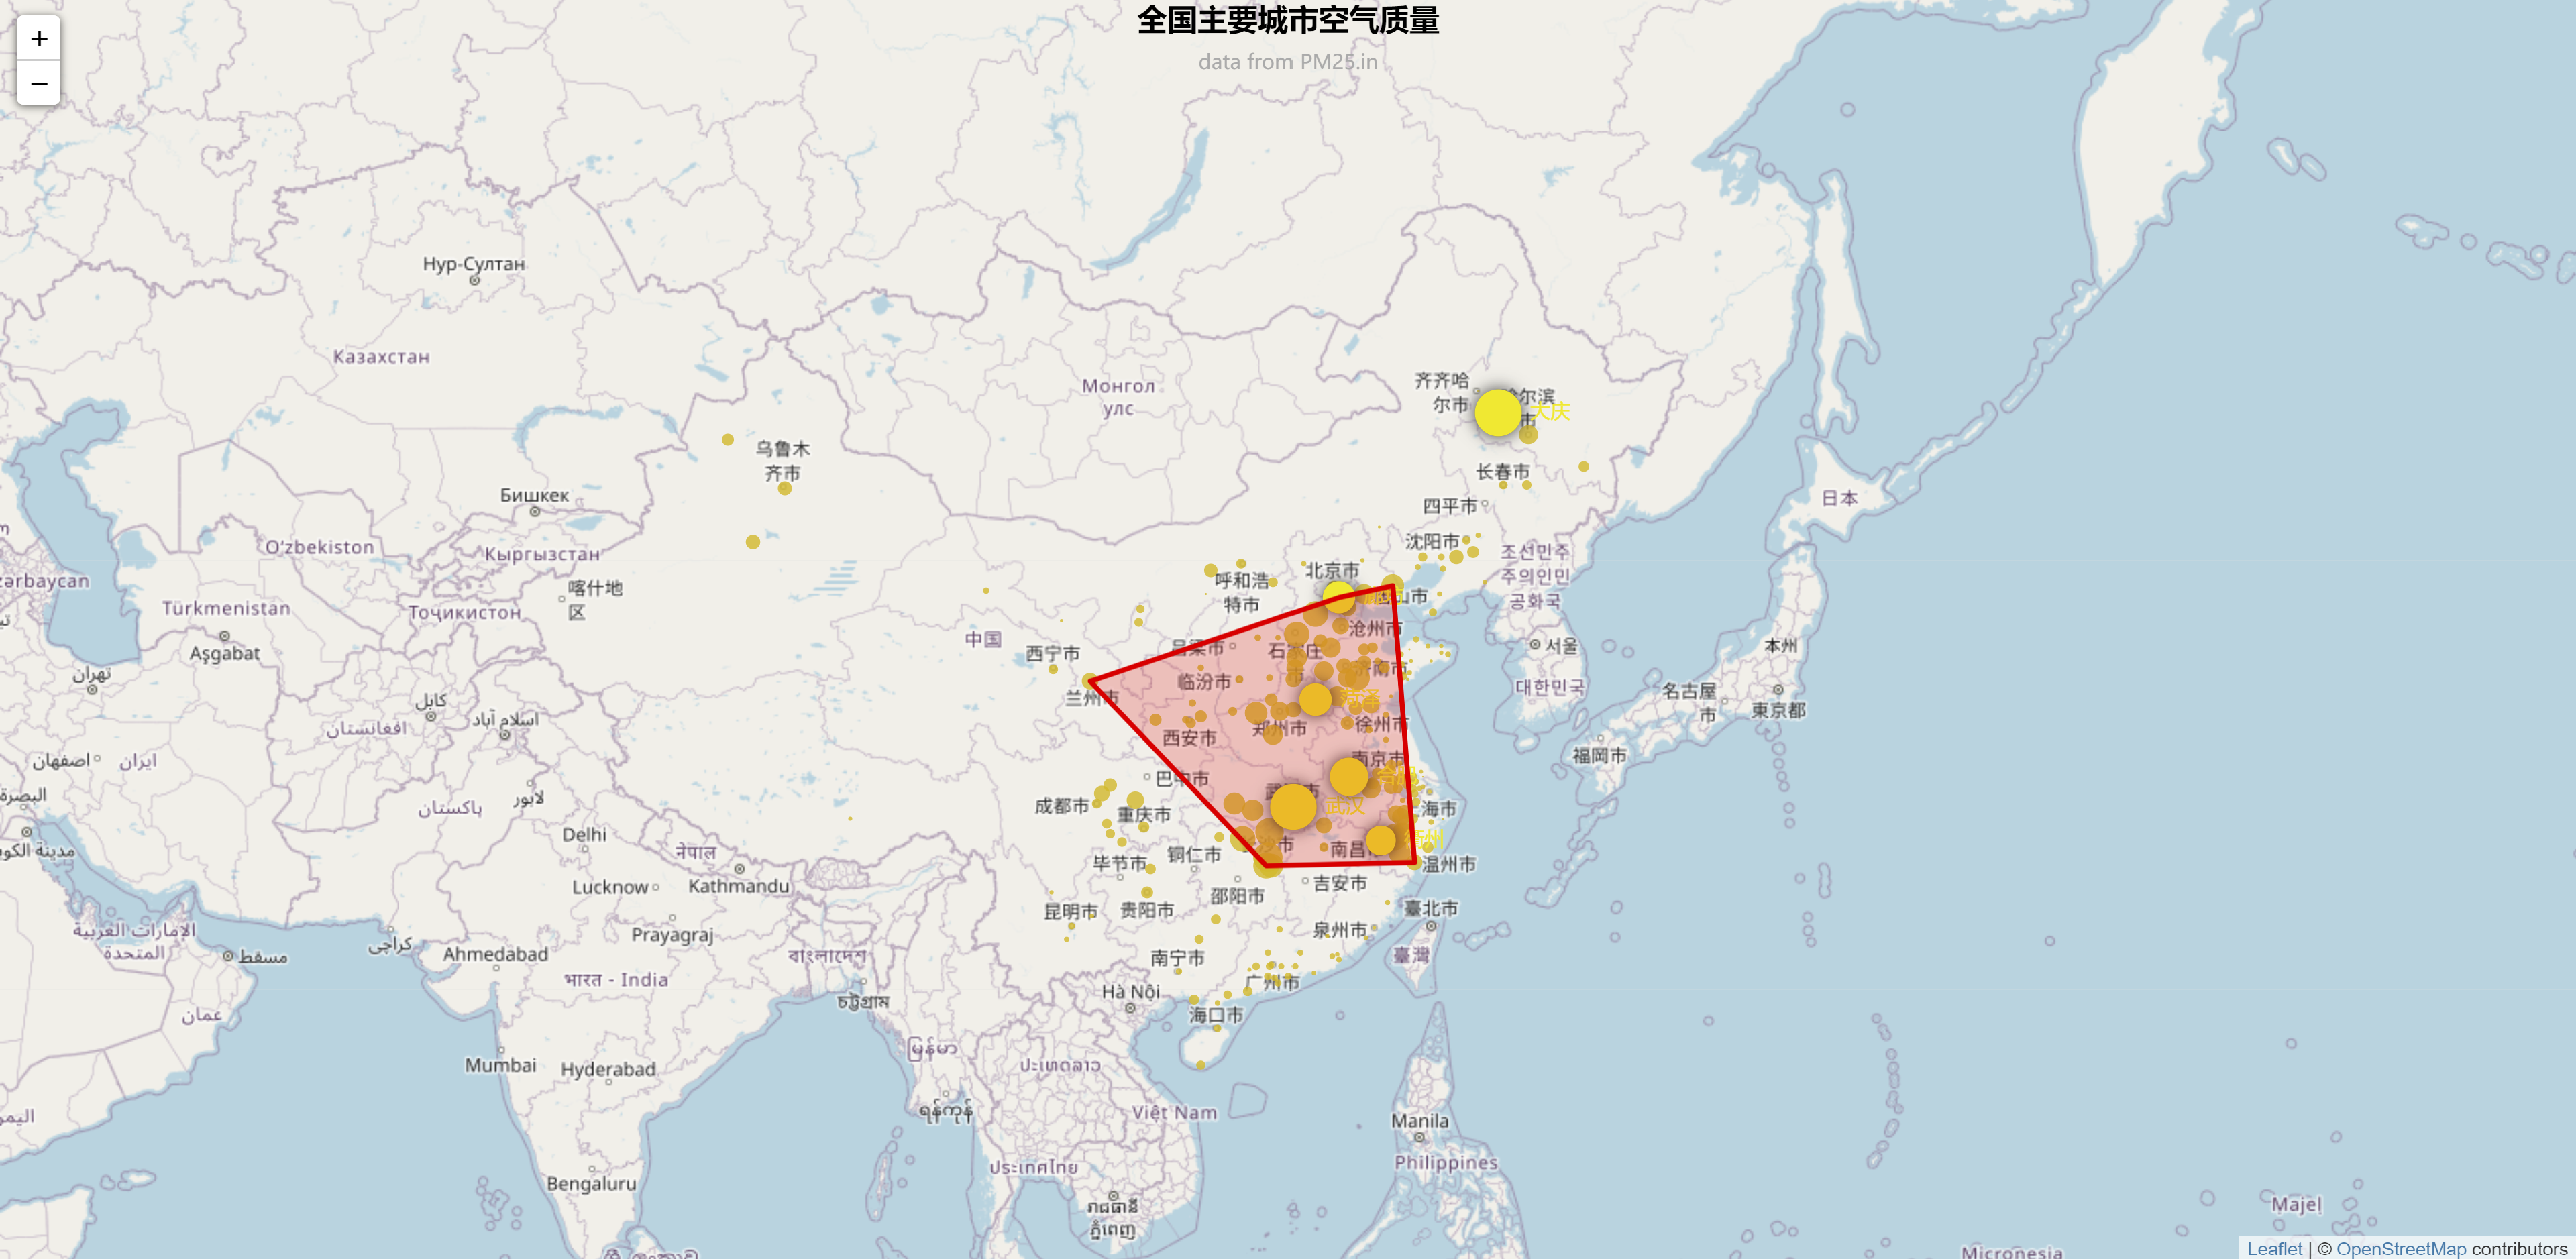
BTW, we can also draw polygons with `leaflet` api and it's not necessary to
use echarts to draw.
```js
var leaflet = myChart.getModel().getComponent('leaflet').getLeaflet();
var latlngs = [
[39.53, 116.7],
[36.03, 103.73],
[27.87, 112.91],
[28.01,120.65],
[39.95, 119.57]
];
L.polygon(latlngs, { color: 'red' }).addTo(leaflet);
```
Also, that's our expected result.
----------------------------------------------------------------
This is an automated message from the Apache Git Service.
To respond to the message, please log on to GitHub and use the
URL above to go to the specific comment.
For queries about this service, please contact Infrastructure at:
[email protected]
---------------------------------------------------------------------
To unsubscribe, e-mail: [email protected]
For additional commands, e-mail: [email protected]