chauncey-zhang commented on issue #12631:
URL:
https://github.com/apache/incubator-echarts/issues/12631#issuecomment-628476217
var data = echarts.dataTool.prepareBoxplotData([
[850, 740, 900, 1070, 930, 850, 950, 980, 980, 880, 1000, 980, 930, 650,
760, 810, 1000, 1000, 960, 960],
[960, 940, 960, 940, 880, 800, 850, 880, 900, 840, 830, 790, 810, 880,
880, 830, 800, 790, 760, 800],
[880, 880, 880, 860, 720, 720, 620, 860, 970, 950, 880, 910, 850, 870,
840, 840, 850, 840, 840, 840],
[890, 810, 810, 820, 800, 770, 760, 740, 750, 760, 910, 920, 890, 860,
880, 720, 840, 850, 850, 780],
[890, 840, 780, 810, 760, 810, 790, 810, 820, 850, 870, 870, 810, 740,
810, 940, 950, 800, 810, 870]
]);
option = {
title: [
{
text: 'Michelson-Morley Experiment',
left: 'center',
},
{
text: 'upper: Q3 + 1.5 * IRQ \nlower: Q1 - 1.5 * IRQ',
borderColor: '#999',
borderWidth: 1,
textStyle: {
fontSize: 14
},
left: '10%',
top: '90%'
}
],
legend: {
data: ['line', 'line2', 'line3']
},
tooltip: {
trigger: 'item',
axisPointer: {
type: 'shadow'
}
},
grid: {
left: '10%',
right: '10%',
bottom: '15%'
},
xAxis: {
type: 'category',
data: data.axisData,
boundaryGap: true,
nameGap: 30,
splitArea: {
show: false
},
axisLabel: {
formatter: 'expr {value}'
},
splitLine: {
show: false
}
},
yAxis: {
type: 'value',
name: 'km/s minus 299,000',
splitArea: {
show: true
}
},
series: [
{
name: 'boxplot',
type: 'boxplot',
data: data.boxData,
itemStyle:{
normal:{
color:'green',
borderColor:'gravity'
}
},
tooltip: {
formatter: function (param) {
return [
'Experiment ' + param.name + ': ',
'upper: ' + param.data[4],
'Q3: ' + param.data[3],
'median: ' + param.data[2],
'Q1: ' + param.data[1],
'lower: ' + param.data[0]
].join('<br/>')
}
}
},
{
name: 'outlier',
type: 'scatter',
data: data.outliers
}
]
};
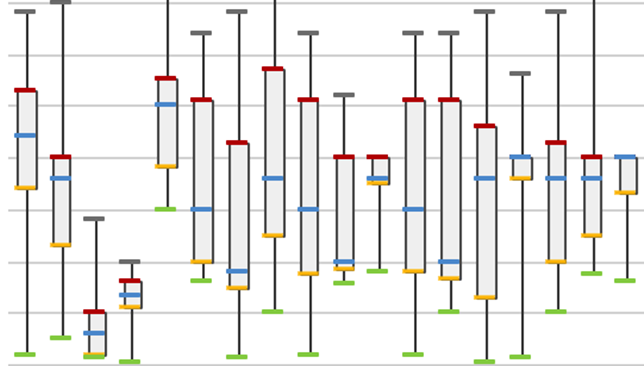
i want to set the q1,q3,median lower and upper lineStyle individual
----------------------------------------------------------------
This is an automated message from the Apache Git Service.
To respond to the message, please log on to GitHub and use the
URL above to go to the specific comment.
For queries about this service, please contact Infrastructure at:
[email protected]
---------------------------------------------------------------------
To unsubscribe, e-mail: [email protected]
For additional commands, e-mail: [email protected]