piyushkrishnan opened a new issue #13019:
URL: https://github.com/apache/incubator-echarts/issues/13019
### Version
4.5.0
### Steps to reproduce
- Create a grouped bar chart to show data at 15 minutes interval with the
following echarts option:
option = {
"backgroundColor": "#212124",
"title": {
"show": false,
"text": "No data",
"left": "center",
"top": "35%",
"textStyle": {
"fontSize": 12,
"color": "#ffffff",
"fontWeight": "lighter",
"fontFamily": "Roboto"
}
},
"tooltip": {
"trigger": "axis",
"axisPointer": {
"type": "shadow"
},
"confine": true,
"textStyle": {
"fontSize": 12,
"color": "#fff",
"fontWeight": "lighter",
"fontFamily": "Roboto"
},
"backgroundColor": "#000",
"padding": 5
},
"legend": {
"show": true,
"type": "scroll",
"pageIconSize": 8,
"pageIconInactiveColor": "#5e5c5c",
"pageIconColor": "#f5eeed",
"pageTextStyle": {
"color": "#f5eeed"
},
"data": [
"Green",
"Red"
],
"icon": "roundRect",
"itemHeight": 4,
"top": "90%",
"left": "left",
"orient": "horizontal",
"align": "auto",
"itemWidth": 13,
"itemGap": 11,
"textStyle": {
"color": "#f5eeed",
"fontSize": 12,
"fontFamily": "Roboto"
}
},
"grid": {
"top": "3%",
"containLabel": true,
"left": "4%",
"bottom": "15%",
"right": "7%"
},
"xAxis": {
"show": true,
"scale": false,
"type": "time",
"min": "2020-07-16T05:30:42.213Z",
"max": "2020-07-16T06:30:42.213Z",
"axisLabel": {
"color": "#f5eeed",
"fontSize": 12,
"showMinLabel": true,
"showMaxLabel": true,
"fontFamily": "Roboto"
},
"axisTick": {
"alignWithLabel": true
},
"axisLine": {
"onZero": false,
"lineStyle": {
"color": "#464648"
}
},
"splitLine": {
"lineStyle": {
"color": "#464648"
}
}
},
"yAxis": {
"show": true,
"type": "value",
"axisLabel": {
"fontSize": 12,
"color": "#f5eeed",
"fontFamily": "Roboto"
},
"axisLine": {
"lineStyle": {
"color": "#464648"
}
},
"splitLine": {
"lineStyle": {
"color": "#464648"
}
}
},
"dataZoom": [
{
"type": "inside"
}
],
"series": [
{
"name": "Green",
"data": [
[
"2020-07-16T06:00:00.000Z",
"97.70"
],
[
"2020-07-16T05:45:00.000Z",
"97.10"
],
[
"2020-07-16T05:30:00.000Z",
"96.40"
],
],
"type": "bar",
"itemStyle": {
"color": "#37872d"
},
"barMaxWidth": "30%"
},
{
"name": "Red",
"data": [
[
"2020-07-16T06:00:00.000Z",
"2.30"
],
[
"2020-07-16T05:45:00.000Z",
"2.90"
],
[
"2020-07-16T05:30:00.000Z",
"3.60"
],
],
"type": "bar",
"smooth": false,
"itemStyle": {
"color": "#c4162a"
},
"barMaxWidth": "30%"
}
]
};
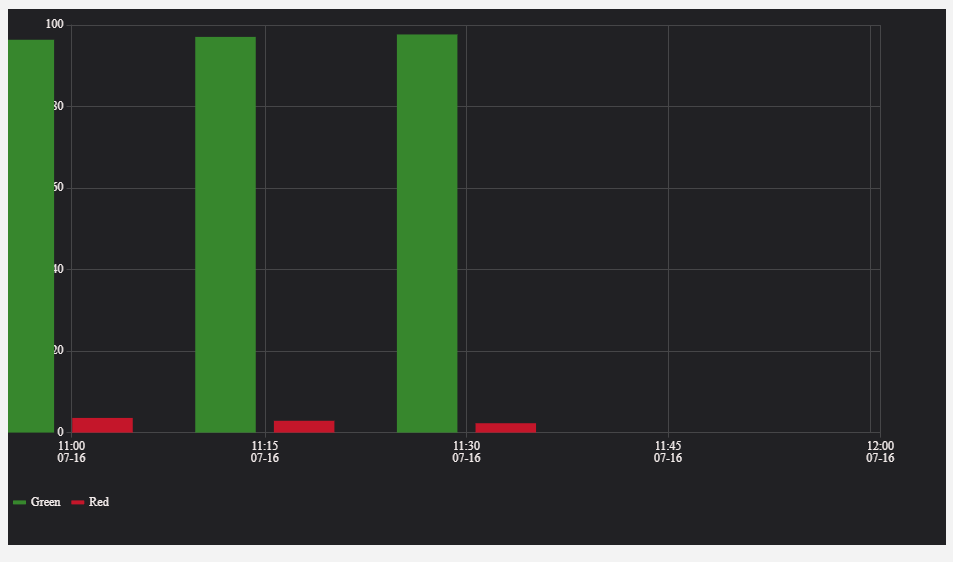
### What is expected?
The bars in the chart should get aligned to the right of the axis tick
instead of center
### What is actually happening?
The bars flow beyond the Y-axis when minimum of the time range has data
available.
<!-- This issue is generated by echarts-issue-helper. DO NOT REMOVE -->
<!-- This issue is in English. DO NOT REMOVE -->
----------------------------------------------------------------
This is an automated message from the Apache Git Service.
To respond to the message, please log on to GitHub and use the
URL above to go to the specific comment.
For queries about this service, please contact Infrastructure at:
[email protected]
---------------------------------------------------------------------
To unsubscribe, e-mail: [email protected]
For additional commands, e-mail: [email protected]