Bilge opened a new issue #13402:
URL: https://github.com/apache/incubator-echarts/issues/13402
### Version 4.9.0 ### Steps to reproduce By default, itemStyle displays items using data point's colour as its border colour. In "dark" theme, this is reversed so that the item's fill colour is the data point colour. However, it seems there is no way for the user to express this, because `series-line.itemStyle.color` and `series-line.itemStyle.borderColor` can only be fixed colours, gradients or textures: they cannot reference the data point's colour. I also checked the [source for the dark theme](https://github.com/apache/incubator-echarts/blob/master/theme/dark.js) to see how it was doing this and there is nothing in the code related to changing the itemStyle's colour to match the data point colour. | Default theme | Dark theme | |-|-| | 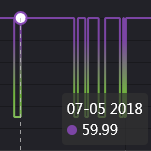 | 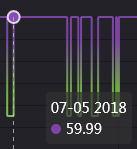 | ### What is expected? User should be able to set the colour using the data point's colour assigned to it by visualMap. ### What is actually happening? User can only set a fixed colour that is not related to the data point's colour. I cannot just change the entire theme to get this effect, because (besides being unintuitive) changing the entire theme has other consequences. <!-- This issue is generated by echarts-issue-helper. DO NOT REMOVE --> <!-- This issue is in English. DO NOT REMOVE --> ---------------------------------------------------------------- This is an automated message from the Apache Git Service. To respond to the message, please log on to GitHub and use the URL above to go to the specific comment. For queries about this service, please contact Infrastructure at: [email protected] --------------------------------------------------------------------- To unsubscribe, e-mail: [email protected] For additional commands, e-mail: [email protected]