echarts-bot[bot] commented on issue #16204:
URL: https://github.com/apache/echarts/issues/16204#issuecomment-990740312
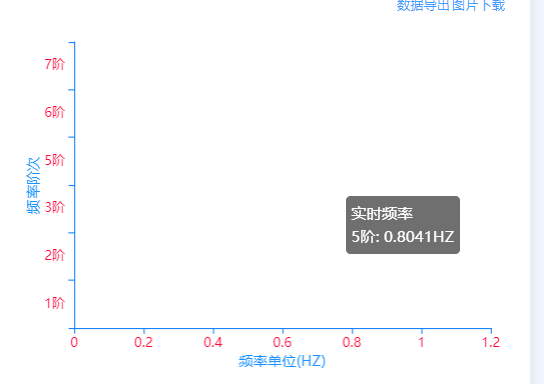
   @958627869 It seems you are not using English, I've helped translate the
content automatically. To make your issue understood by more people and get
helped, we'd like to suggest using English next time. 🤗
   <details><summary><b>TRANSLATED</b></summary><br>

   **TITLE**

   [Bug] The chart has data, and the floating window can also show data, but
the column does not come out

   **BODY**

   ### Version

   4.9.0

   ### Link to Minimal Reproduction

   _No response_

   ### Steps to Reproduce

   not

   ### Current Behavior

   ! (QQ Picture 20211210163627)
(https://user-images.githubusercontent.com/40757835/145543289-389d085c-66d8-4b4d-93cd-6bbdcf3461d7.png)
   The vue component encapsulation, where multiple histograms are generated,
canvasids are different, and the data is all right

   ### Expected Behavior

   not

   ### Environment

   ```markdown
   - OS:
   - Browser:
   - Framework:
   ```

   ### Any additional comments?

   _No response_
   </details>


--
This is an automated message from the Apache Git Service.
To respond to the message, please log on to GitHub and use the
URL above to go to the specific comment.

To unsubscribe, e-mail: [email protected]

For queries about this service, please contact Infrastructure at:
[email protected]


---------------------------------------------------------------------
To unsubscribe, e-mail: [email protected]
For additional commands, e-mail: [email protected]