FriendsA opened a new issue #16494:
URL: https://github.com/apache/echarts/issues/16494
### Version 5.3.0 ### Link to Minimal Reproduction https://echarts.apache.org/examples/en/editor.html ### Steps to Reproduce 1. use option like this `option = { xAxis: { type: 'time', minInterval: 3600 * 23 * 1000, axisLabel: { formatter: '{yyyy}-{MM}-{dd}', hideOverlap: true } }, yAxis: [ { type: 'value' } ], series: [ { data: [['2021-12-31', 10]], type: 'line' } ] };` 2. xAxis don't show the coordinates '2021-12-31', and occur condition: 1) only one point and is the last day of the year 2) xAxis: set minInterval is one day (3600 * 24 * 1000),set type is 'time' if you change any other day like '2021-12-30', the coordinates of xAxis will appear。  wrong situation 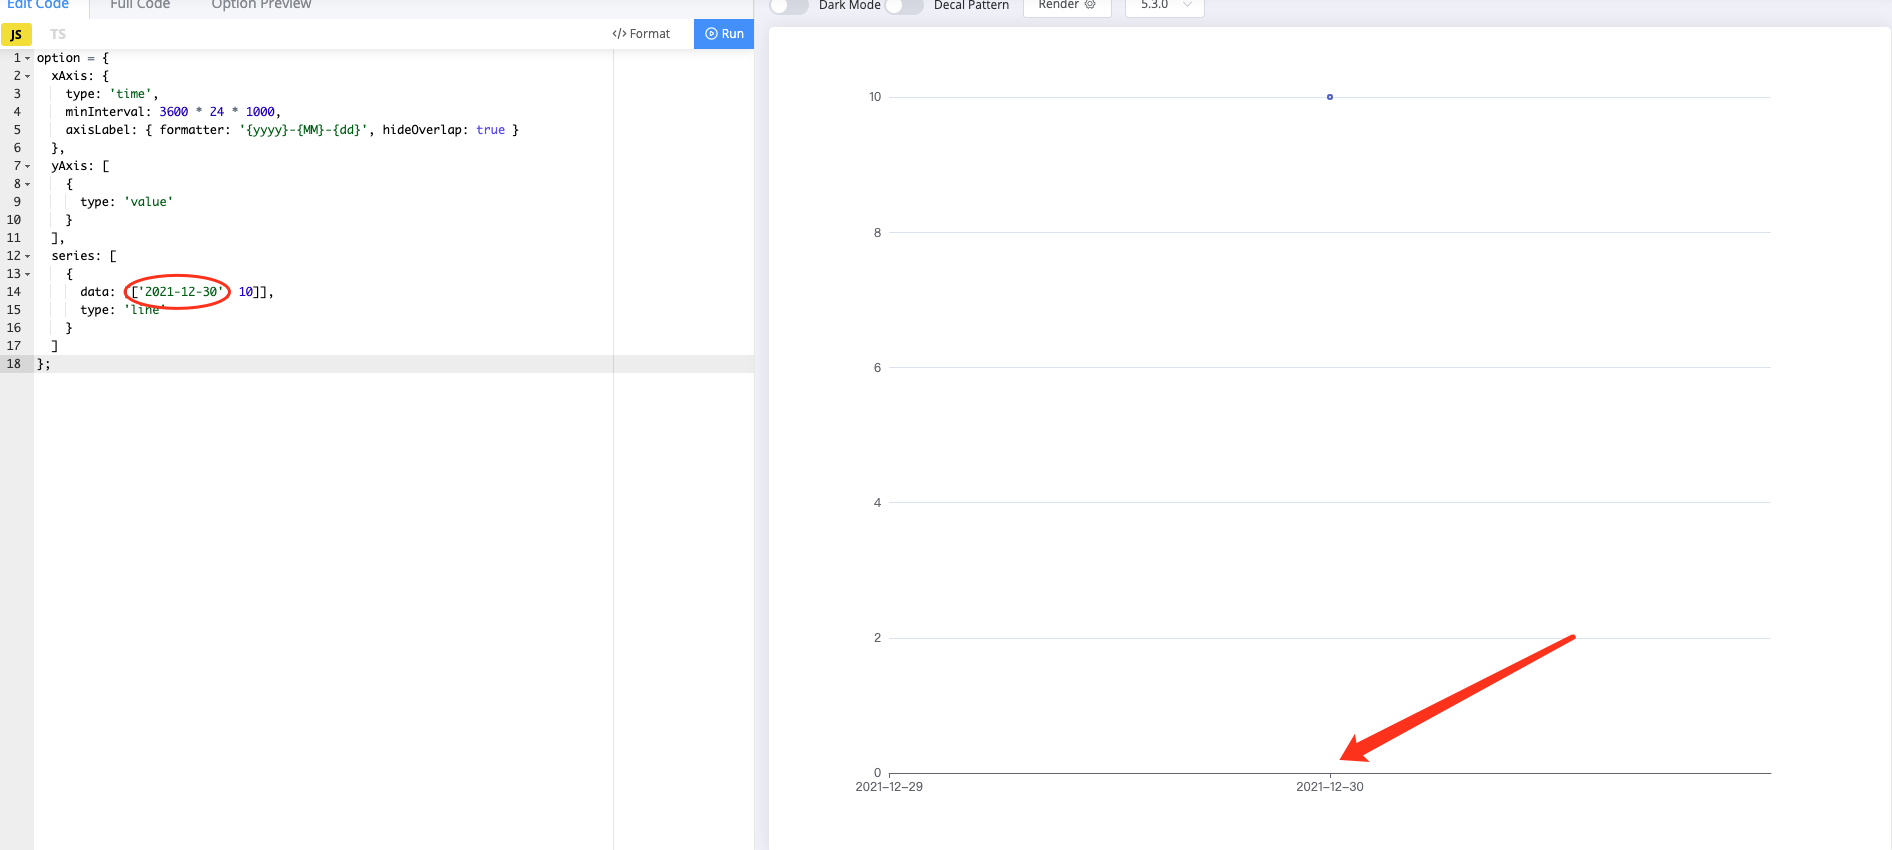 normal condition ### Current Behavior don't show coordinates of date ### Expected Behavior hope can show the coordinates of date ### Environment ```markdown - OS:macOS Big Sur - Browser: Chrome ~92 - Framework:React ``` ### Any additional comments? _No response_ -- This is an automated message from the Apache Git Service. To respond to the message, please log on to GitHub and use the URL above to go to the specific comment. To unsubscribe, e-mail: [email protected] For queries about this service, please contact Infrastructure at: [email protected] --------------------------------------------------------------------- To unsubscribe, e-mail: [email protected] For additional commands, e-mail: [email protected]