XSe70 opened a new issue #16593:
URL: https://github.com/apache/echarts/issues/16593
### Version
5.3.0
### Link to Minimal Reproduction
_No response_
### Steps to Reproduce
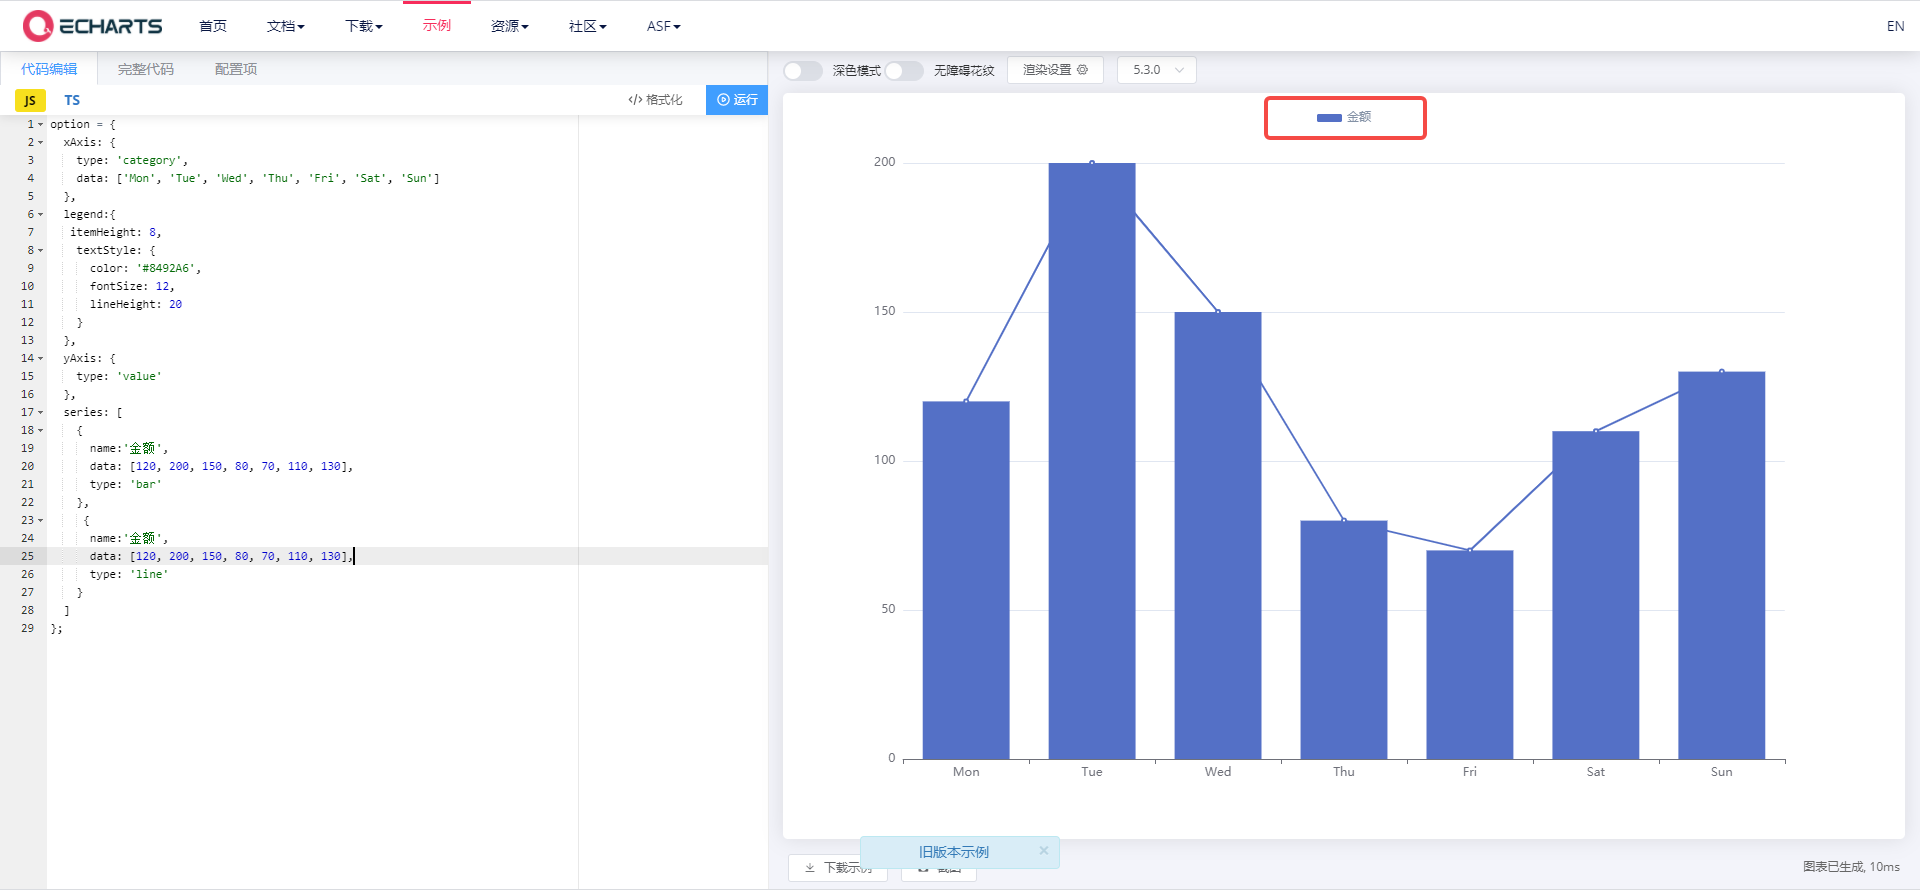
option = {
xAxis: {
type: 'category',
data: ['Mon', 'Tue', 'Wed', 'Thu', 'Fri', 'Sat', 'Sun']
},
legend:{
itemHeight: 8,
textStyle: {
color: '#8492A6',
fontSize: 12,
lineHeight: 20
}
},
yAxis: {
type: 'value'
},
series: [
{
name:'金额',
data: [120, 200, 150, 80, 70, 110, 130],
type: 'bar'
},
{
name:'金额',
data: [120, 200, 150, 80, 70, 110, 130],
type: 'line'
}
]
};
### Current Behavior
### Expected Behavior
I want the chart to show two different color types of legend's labels
### Environment
```markdown
- OS:window10:
- Browser:chrome 84.0.4147.125
- Framework:Vue@2
```
### Any additional comments?
Encountered when encapsulating Echarts-based components
--
This is an automated message from the Apache Git Service.
To respond to the message, please log on to GitHub and use the
URL above to go to the specific comment.
To unsubscribe, e-mail: [email protected]
For queries about this service, please contact Infrastructure at:
[email protected]
---------------------------------------------------------------------
To unsubscribe, e-mail: [email protected]
For additional commands, e-mail: [email protected]