ragava28 opened a new issue #16689:
URL: https://github.com/apache/echarts/issues/16689
### What problem does this feature solve? Hi , we are looking for a feature to drag object across the gauge circle . ex: in below image we we want to move the triangle across boundaries & get new polor coordinates ( angle & radius). 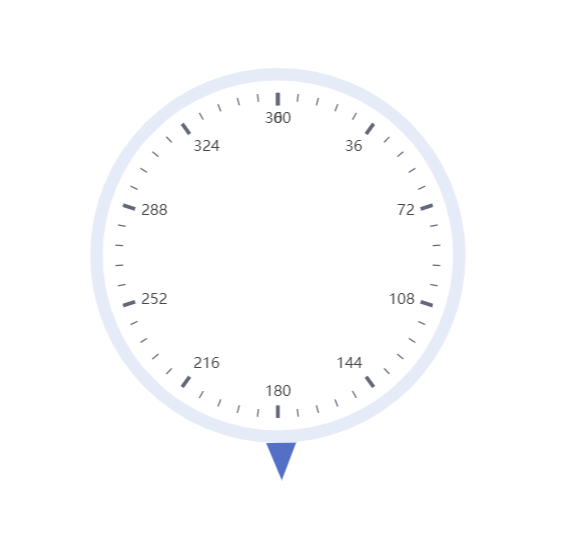 I followed the sample in below example https://echarts.apache.org/examples/en/editor.html?c=line-draggable but got stuck in these area. 1. How to matching the coordinates of draggable object(graphic) with static object ( please uncomment the commented code to see draggable object). 2. How to move the draggable object only across gauge circle . 3. How to get new polor coordinates based on Cartesian coordinates . Please share if you have any thoughts . sample code ===== const data = [{ value: 179 }]; // in degrees option = { tooltip: { show: false, trigger: 'axis' }, series: [ { name: 'circle', type: 'gauge', startAngle: 90, endAngle: -270, radius: '150', min: 0, max: 360, clockwise: true, pointer: { show: false }, detail: { show: false }, data: [{ value: 89 }] }, { name: 'pointofviewicon', type: 'gauge', startAngle: 90, endAngle: -270, radius: '150', min: 0, max: 360, clockwise: true, axisLine: { show: false }, splitLine: { show: false }, axisTick: { show: false }, axisLabel: { show: false }, pointer: { icon: 'triangle', width: 24, length: 30, offsetCenter: [0, '-100%'] }, detail: { show: false }, title: { offsetCenter: ['0%', '-40%'] }, data: [{ value: 179 }] } ] }; // setTimeout(function () { // debugger; // var [cx, cy] = polarToCartesian(300, 200, 50, 180); // myChart.setOption({ // graphic: [ // { // type: 'circle', // id: 'small_circle', // shape: { // cx: cx, // cy: cy, // r: 40 / 2 // }, // style: { // fill: 'red' // }, // invisible: false, // draggable: true, // ondrag: function (dx, dy) { // onPointDragging(dataIndex, [this.x, this.y]); // }, // z: 100 // } // ] // }); // }, 0); // function polarToCartesian(centerX, centerY, radius, angleInDegrees) { // var angleInRadians = ((angleInDegrees - 90) * Math.PI) / 180.0; // return [ // centerX + radius * Math.cos(angleInRadians), // centerY + radius * Math.sin(angleInRadians) // ]; // } // function onPointDragging(dataIndex, pos) { // debugger; // data[dataIndex] = myChart.convertFromPixel('grid', pos); // // Update data // myChart.setOption({ // series: [ // { // id: 'a', // data: data // } // ] // }); // } ### What does the proposed API look like? Please redirect me to any sample. -- This is an automated message from the Apache Git Service. To respond to the message, please log on to GitHub and use the URL above to go to the specific comment. To unsubscribe, e-mail: [email protected] For queries about this service, please contact Infrastructure at: [email protected] --------------------------------------------------------------------- To unsubscribe, e-mail: [email protected] For additional commands, e-mail: [email protected]