echarts-bot[bot] commented on issue #16741:
URL: https://github.com/apache/echarts/issues/16741#issuecomment-1077470990
@crazy-wang It seems you are not using English, I've helped translate the content automatically. To make your issue understood by more people and get helped, we'd like to suggest using English next time. 🤗 <details><summary><b>TRANSLATED</b></summary><br> **TITLE** [Bug] series-bar.labelLayout. The value of dx is not rendered correctly to the corresponding scale position after performing resize after the chart container size change **BODY** ### Version echarts@5+ ### Link to Minimal Reproduction _No response_ ### Steps to Reproduce For the histogram, set the label label to the top display, and then control the position by setting the dx, and adjust the dx to the appropriate position. After the window size is changed, the resize method of echarts is triggered, and the echarts graphics will be adaptively resized according to the original proportion, but the value set by dx is not adjusted according to the original proportion. You must refresh the page to get to the scale position. This can be reproduced very quickly: You enter this link, the official demo https://echarts.apache.org/examples/zh/editor.html?c=bar-background Then add a few lines of code in my figure, this time the label label is in the middle of the column. The effect as shown below. Then you change the size of the browser window, and you can see that the size of the echarts graph will be adaptively changed according to the proportion, but the position of the label label will not be adaptively changed, so it will not be centered, and then keep the window size unchanged, and then click Run to be centered.  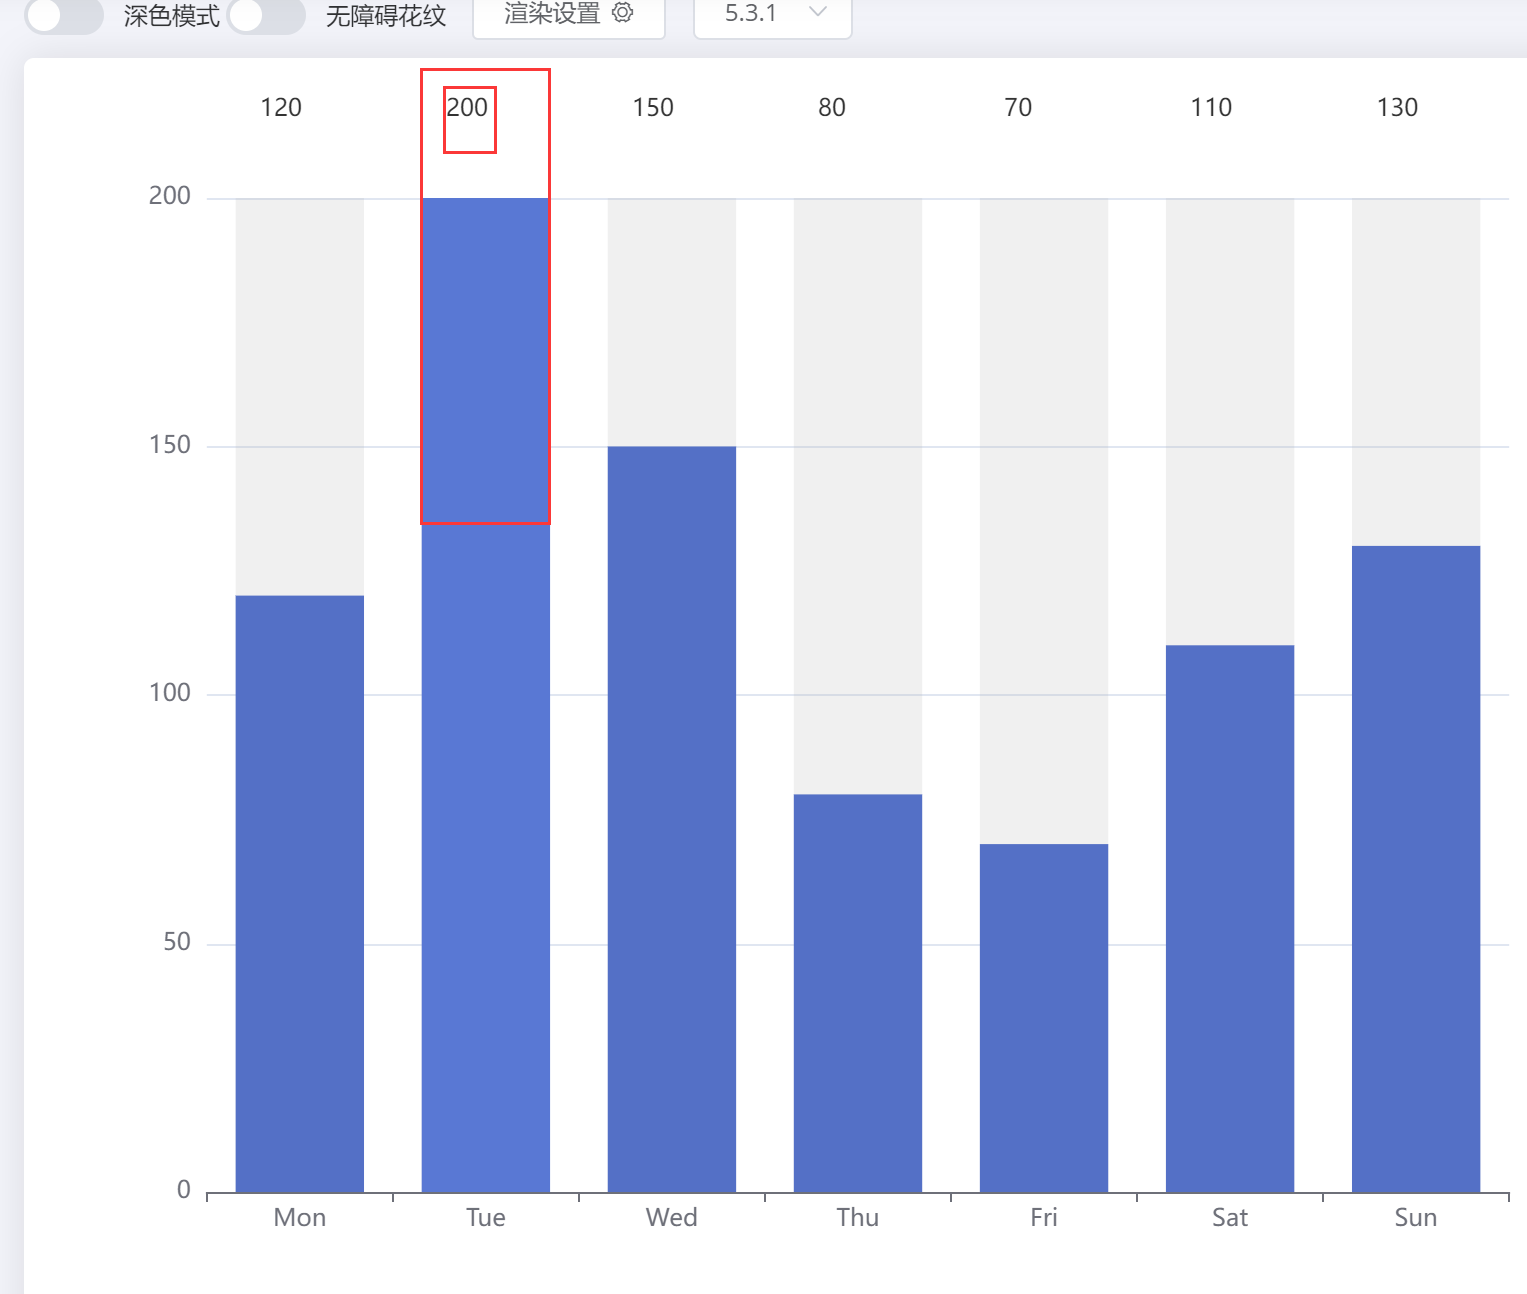 label: { show: true }, labelLayout: { y: 10, dx: -10 } ### Current Behavior For the histogram, set the label label to the top display, and then control the position by setting the dx, and adjust the dx to the appropriate position. After the window size is changed, the resize method of echarts is triggered, and the value of dx set by the echarts graphics is not adjusted according to the original proportion. You must refresh the page to get to the scale position. ### Expected Behavior Please don't remove the waiting tag for no reason. Please let me know if this is a bug. included in the solution plan. Normally, the value of dx should be set to an appropriate position based on the initial coordinate position of the new image after changing the size. ### Environment ````markdown - OS: win10 - Browser: Chrome - Framework: Vue@2 ```` ### Any additional comments? 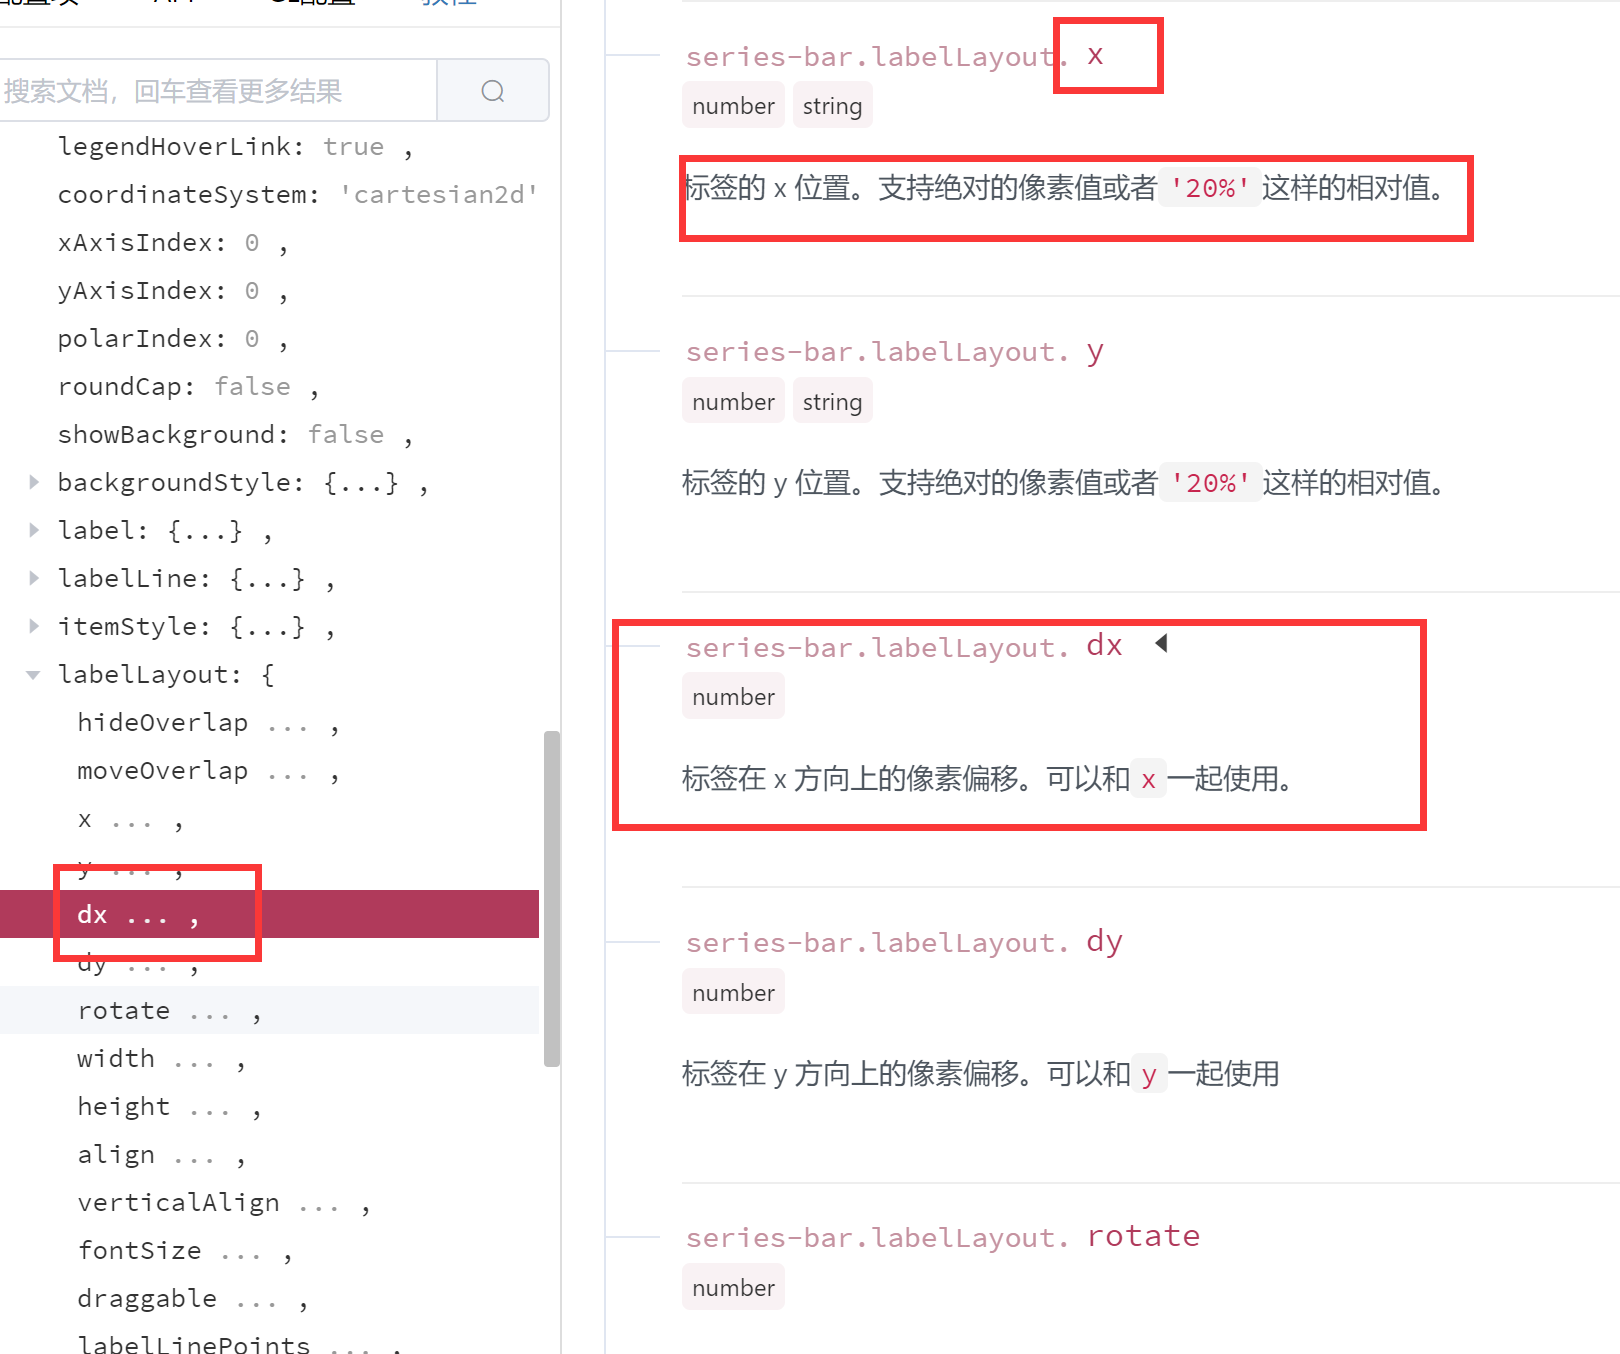 </details> -- This is an automated message from the Apache Git Service. To respond to the message, please log on to GitHub and use the URL above to go to the specific comment. To unsubscribe, e-mail: [email protected] For queries about this service, please contact Infrastructure at: [email protected] --------------------------------------------------------------------- To unsubscribe, e-mail: [email protected] For additional commands, e-mail: [email protected]