DavidMarquezF opened a new issue, #17210:
URL: https://github.com/apache/echarts/issues/17210
### What problem does this feature solve?
There is no way to create marker lines for each bar with an appropiate
width. There is a workaround with marker pointers, but the width has to be
hardcoded, which means that it doesn't respond to changes in number of bars,
redimension, etc.
The workaround:
```
option = {
title: {
text: 'Rainfall vs Evaporation',
subtext: 'Fake Data'
},
tooltip: {
trigger: 'axis'
},
legend: {
data: ['Rainfall', 'Evaporation']
},
toolbox: {
show: true,
feature: {
dataView: { show: true, readOnly: false },
magicType: { show: true, type: ['line', 'bar'] },
restore: { show: true },
saveAsImage: { show: true }
}
},
calculable: true,
xAxis: [
{
type: 'category',
// prettier-ignore
data: ['Jan', 'Feb', 'Mar', 'Apr', 'May', 'Jun', 'Jul', 'Aug', 'Sep',
'Oct', 'Nov', 'Dec']
}
],
yAxis: [
{
type: 'value'
}
],
series: [
{
name: 'Rainfall',
type: 'bar',
data: [
2.0, 4.9, 7.0, 23.2, 25.6, 76.7, 135.6, 162.2, 32.6, 20.0, 6.4, 3.3
],
markPoint: {
data: [
{ type: 'max', name: 'Max' },
{ type: 'min', name: 'Min', coord: [10,10] }
],
symbol: "rect",
silent: true,
symbolSize: [40,3],
itemStyle: {color: "black"},
label: {show: false },
},
},
{
name: 'Evaporation',
type: 'bar',
data: [
2.6, 5.9, 9.0, 26.4, 28.7, 70.7, 175.6, 182.2, 48.7, 18.8, 6.0, 2.3
],
}
]
};
```
Result:
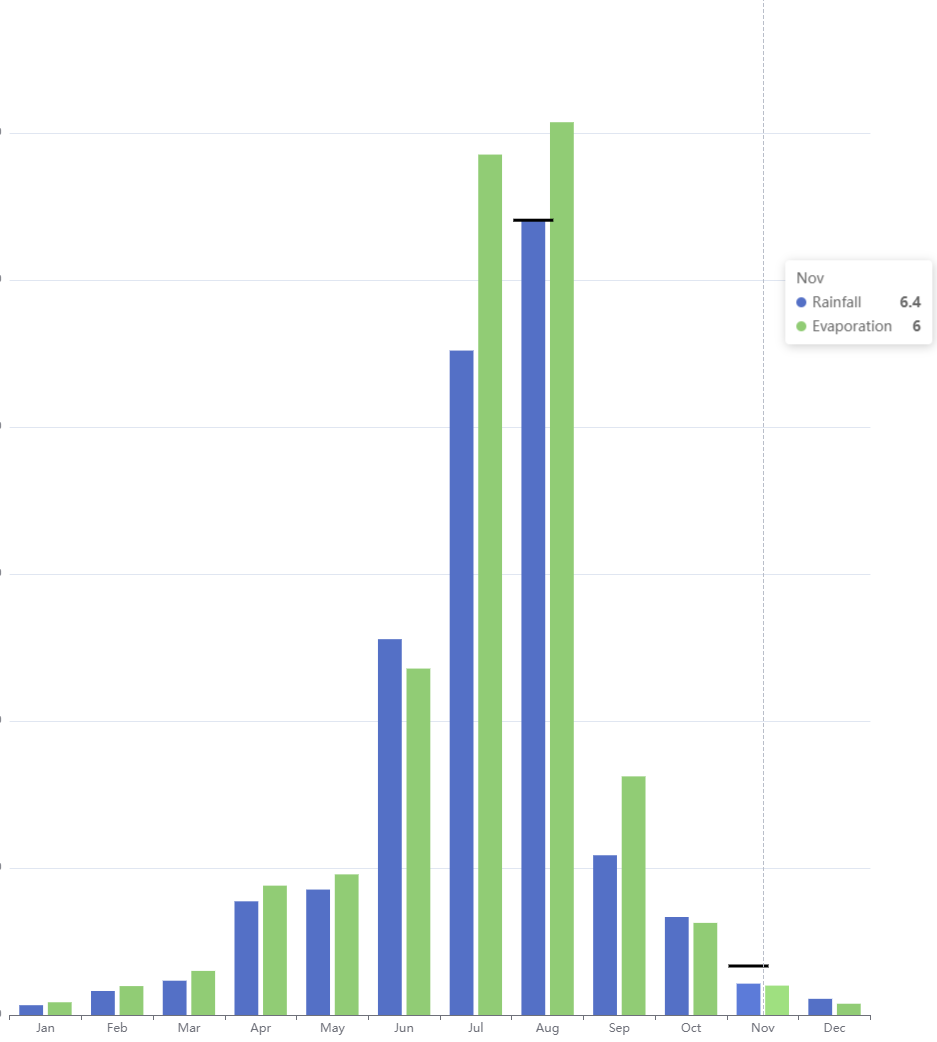
### What does the proposed API look like?
Add a new option for the bar series `barMarker`, which would have a data
property with the ordered value of the markers. It could also just have a
reference to a dataset with `datasetIndex`. Another option would be to have a
list of objects with the dimension name and the value to assign (this way you
would be able to omit columns).
It should have styling options similar to the ones offered by markPoint:
* Specify symbol (it could be a circle, line, dotted line, etc.)
* Label
* Color
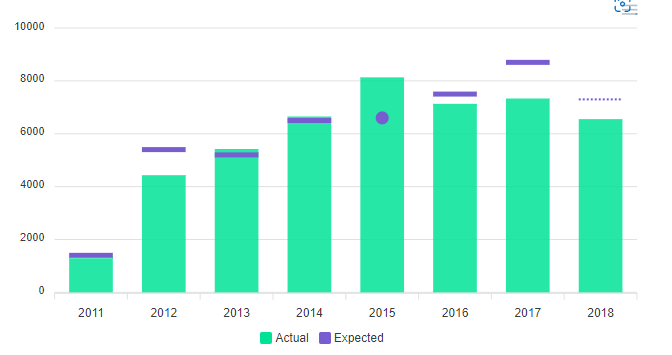
* Etc.
This would allow us to create things like this (photo from apexcharts):
Another way of doing this would be with the `markPointer` like the
workaround but allow to set a custom string for the size (something like
`['barWidth', 3]`)
--
This is an automated message from the Apache Git Service.
To respond to the message, please log on to GitHub and use the
URL above to go to the specific comment.
To unsubscribe, e-mail: [email protected]
For queries about this service, please contact Infrastructure at:
[email protected]
---------------------------------------------------------------------
To unsubscribe, e-mail: [email protected]
For additional commands, e-mail: [email protected]