DavidMarquezF commented on issue #13557:
URL: https://github.com/apache/echarts/issues/13557#issuecomment-1157584731
From what it looks like they do not plan on implementing it: https://github.com/apache/echarts/issues/8796#issuecomment-410164328 I'll quote the message by @Ovilia here: > Thanks @amittonge . It's true that axis range will not automatically change due to markline data. I believe this makes sense since _markline_ is served as a _mark_ rather than data. And if the related data is not in the range, the markline is designed to be hidden. We recommend you set max to the data value related to the markline you want to display. While I do agree with her statement I think there should be the option to enable taking into account markLines and markPoints. , since it is normal to use them to mark important things such as targets and therefore it makes sense to show them even if they are outside the data's range. Maybe add a helper in the max/min of the xAxis and yAxis similar to `'dataMin'` and `'dataMax'` (like `'chartMax'` and `'chartMin'`?). The current problem with a workaround (which is just specifying the max value yourself) is that then the axis interval is not respected (see image below, where the interval is 20 but the max is set to 110): 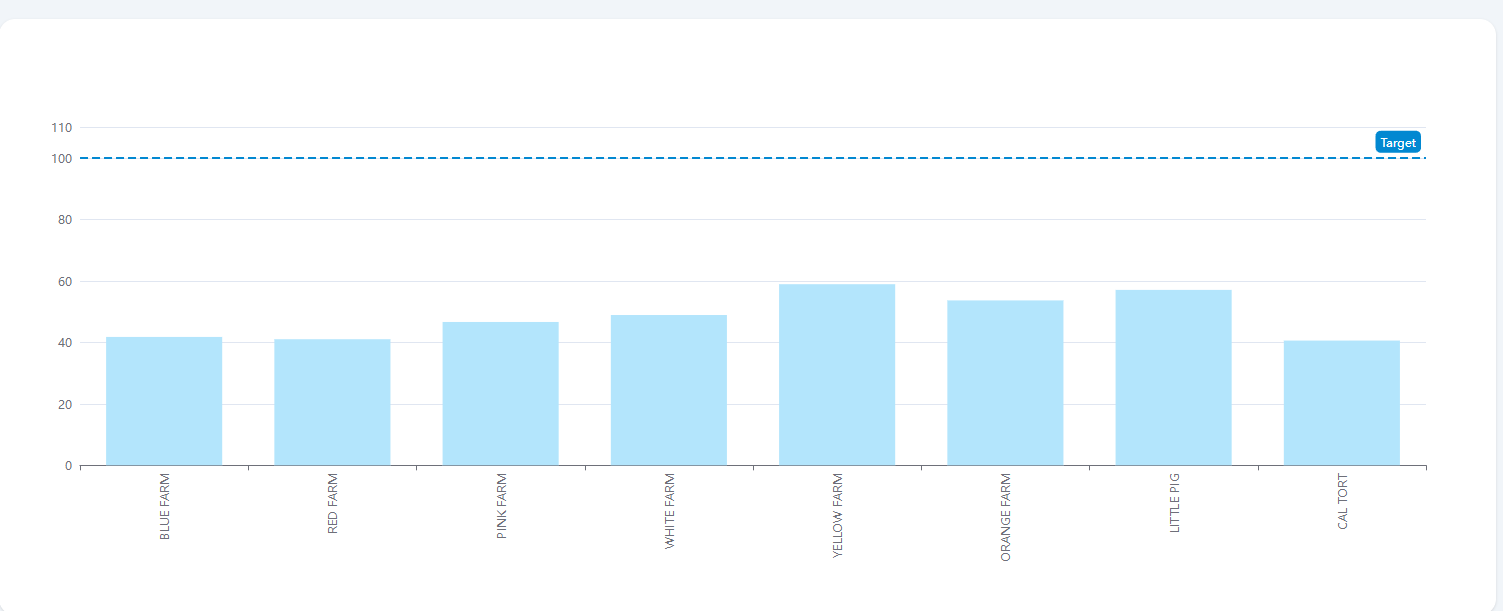 -- This is an automated message from the Apache Git Service. To respond to the message, please log on to GitHub and use the URL above to go to the specific comment. To unsubscribe, e-mail: [email protected] For queries about this service, please contact Infrastructure at: [email protected] --------------------------------------------------------------------- To unsubscribe, e-mail: [email protected] For additional commands, e-mail: [email protected]