hellonicing opened a new issue, #18038:
URL: https://github.com/apache/echarts/issues/18038
### Version 5.4.0 ### Link to Minimal Reproduction https://codesandbox.io/s/wandering-monad-dtlyws ### Steps to Reproduce add the config,xAxis.axisLine. onZero,series.data include negative number ### Current Behavior I have negative data to display, but I want to pan down the x-axis and start displaying from the negative numbers up. 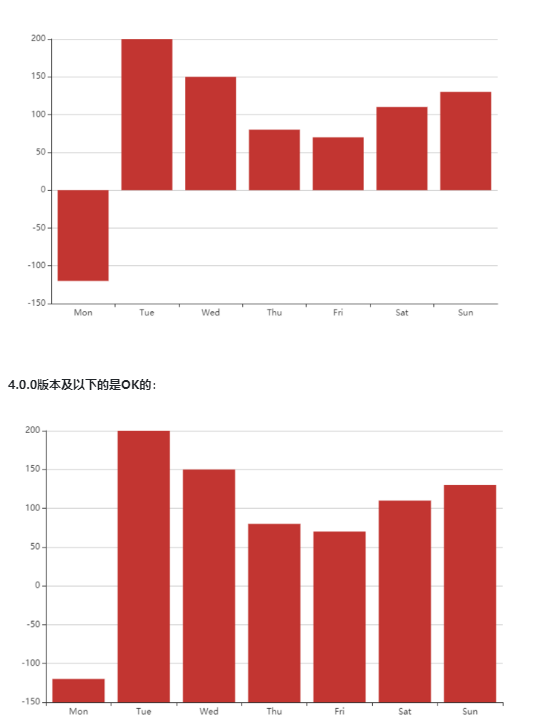 As in the picture, I want the effect of the picture below, but in reality it is like the picture above. ### Expected Behavior The same 3D bar chart has this problem, I need the z-axis to start with a negative number. 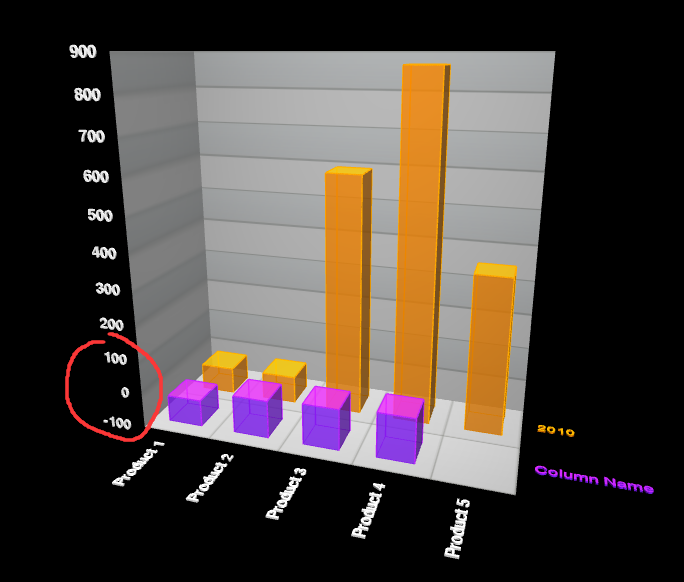 Like in the picture, the Z-axis is displayed from negative numbers upwards ### Environment ```markdown - OS:windows10 - Browser:Chrome108 - Framework:js ``` ### Any additional comments? _No response_ -- This is an automated message from the Apache Git Service. To respond to the message, please log on to GitHub and use the URL above to go to the specific comment. To unsubscribe, e-mail: [email protected] For queries about this service, please contact Infrastructure at: [email protected] --------------------------------------------------------------------- To unsubscribe, e-mail: [email protected] For additional commands, e-mail: [email protected]