echarts-bot[bot] commented on issue #18073:
URL: https://github.com/apache/echarts/issues/18073#issuecomment-1355975840
@minren118 It seems you are not using English, I've helped translate the content automatically. To make your issue understood by more people and get helped, we'd like to suggest using English next time. 🤗 <details><summary><b>TRANSLATED</b></summary><br> **TITLE** [Bug] In the map series, data labels are displayed out of place if the longitude is negative **BODY** ### Version 5.4 ### Link to Minimal Reproduction _No response_ ### Steps to Reproduce I use a map data made by myself, which contains a cp node. Normally, it will call this cp node to customize the position of the rendered data label, but now when using the world map, because its latitude and longitude spans -180 to 180 and -90 to 90, the longitude of 0-180 is displayed normally, and when it is -180-0, it is abnormal. For example, the longitude of -100 in the United States, the data label shows the location of China, and the latitude display is also abnormal, such as Australia. This jaundice is only abnormal on the data label, but it is normal on the scatter map.  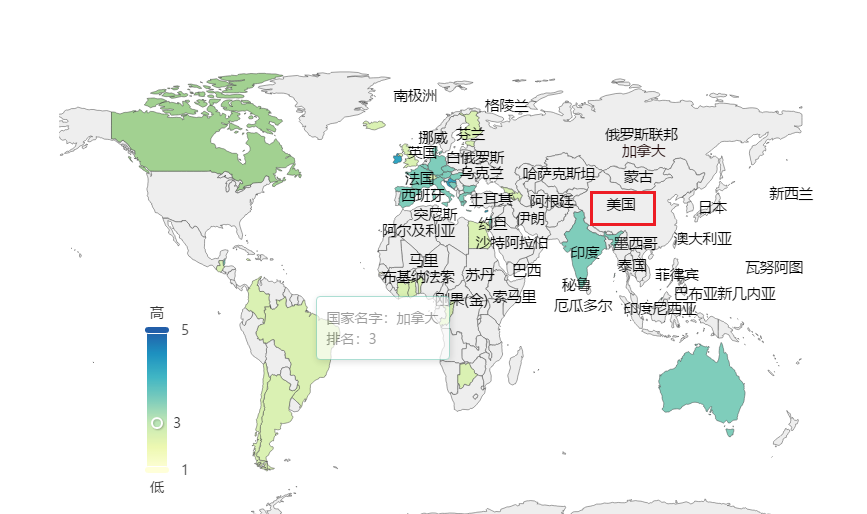 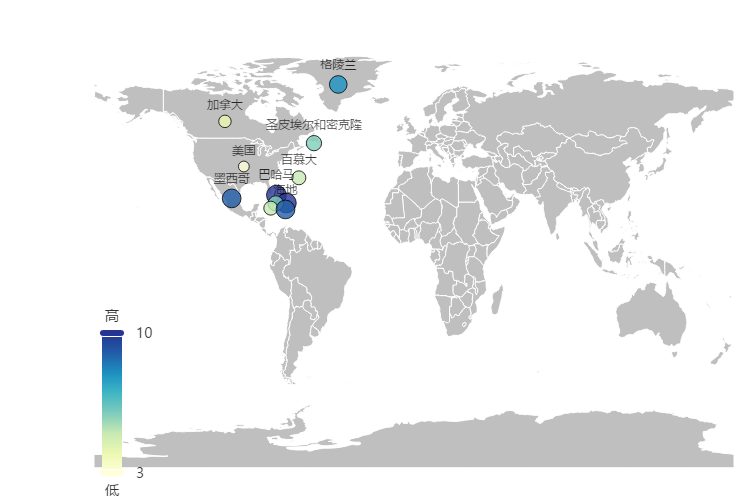 ### Current Behavior There is a problem with the display of data labels being misplaced. ### Expected Behavior Looking forward to fixing the problem that when the cp value is used as a coloring map, the wrong position of the data label is displayed. ### Environment ```markdown - OS: -Browser: - Framework: ``` ### Any additional comments? _No response_ </details> -- This is an automated message from the Apache Git Service. To respond to the message, please log on to GitHub and use the URL above to go to the specific comment. To unsubscribe, e-mail: [email protected] For queries about this service, please contact Infrastructure at: [email protected] --------------------------------------------------------------------- To unsubscribe, e-mail: [email protected] For additional commands, e-mail: [email protected]