linwrui opened a new issue, #18177:
URL: https://github.com/apache/echarts/issues/18177
### Version
5.4.1
### Link to Minimal Reproduction
_No response_
### Steps to Reproduce
You can reproduce at official demo editor with options like
```js
option = {
animationEasing: 'linear',
animationDuration: 8000,
animationDurationUpdate: 0,
xAxis: {
type: 'value',
min: -10,
},
yAxis: {
type: 'value',
axisLine: {
onZero: false,
}
},
series: [
{
connectNulls: true,
data: [218, 135, 147, 260].map((o, index) => [index, o]),
type: 'line'
}
]
};
console.log(option.series)
```
### Current Behavior
As the title says, the line graph animation didn't start immediately, but
waited for a long blank time, which I guess was caused by the animation delay
on the previous blank data
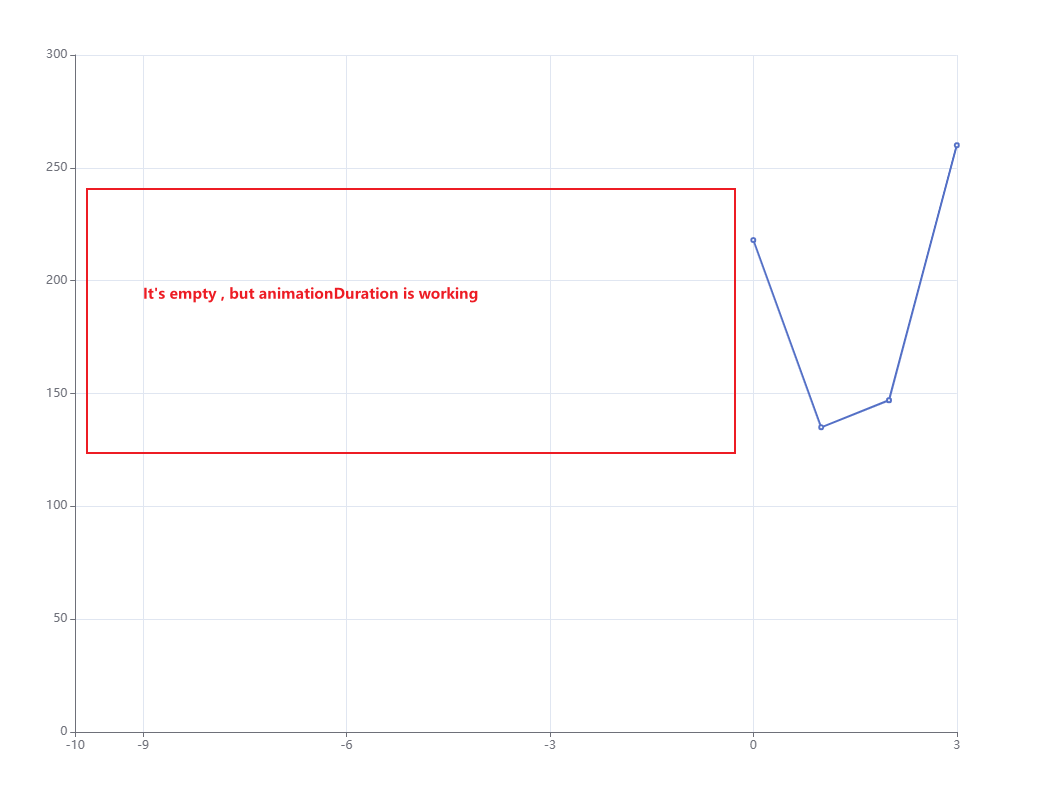
### Expected Behavior
I expected animationDuration will not working on empty data
### Environment
```markdown
- OS:
- Browser:
- Framework:
```
### Any additional comments?
_No response_
--
This is an automated message from the Apache Git Service.
To respond to the message, please log on to GitHub and use the
URL above to go to the specific comment.
To unsubscribe, e-mail: [email protected]
For queries about this service, please contact Infrastructure at:
[email protected]
---------------------------------------------------------------------
To unsubscribe, e-mail: [email protected]
For additional commands, e-mail: [email protected]