This is an automated email from the ASF dual-hosted git repository.

caogaofei pushed a commit to branch main
in repository https://gitbox.apache.org/repos/asf/iotdb-docs.git
The following commit(s) were added to refs/heads/main by this push:
new c1005ab Add configuration instance information and other related
content
c1005ab is described below
commit c1005ab74d563b0767e40f69ec98a03f1b185101
Author: majialin <[email protected]>
AuthorDate: Fri Aug 9 17:34:12 2024 +0800
Add configuration instance information and other related content
---
.../workbench-deployment.md | 34 ++++++++++++++++++----
.../workbench-deployment.md | 34 ++++++++++++++++++----
.../workbench-deployment.md | 32 ++++++++++++++++----
.../workbench-deployment.md | 32 ++++++++++++++++----
4 files changed, 110 insertions(+), 22 deletions(-)
diff --git
a/src/UserGuide/Master/Deployment-and-Maintenance/workbench-deployment.md
b/src/UserGuide/Master/Deployment-and-Maintenance/workbench-deployment.md
index 42d49a4..73e25f1 100644
--- a/src/UserGuide/Master/Deployment-and-Maintenance/workbench-deployment.md
+++ b/src/UserGuide/Master/Deployment-and-Maintenance/workbench-deployment.md
@@ -164,7 +164,7 @@ The visualization console is one of the supporting tools
for IoTDB. It is an off
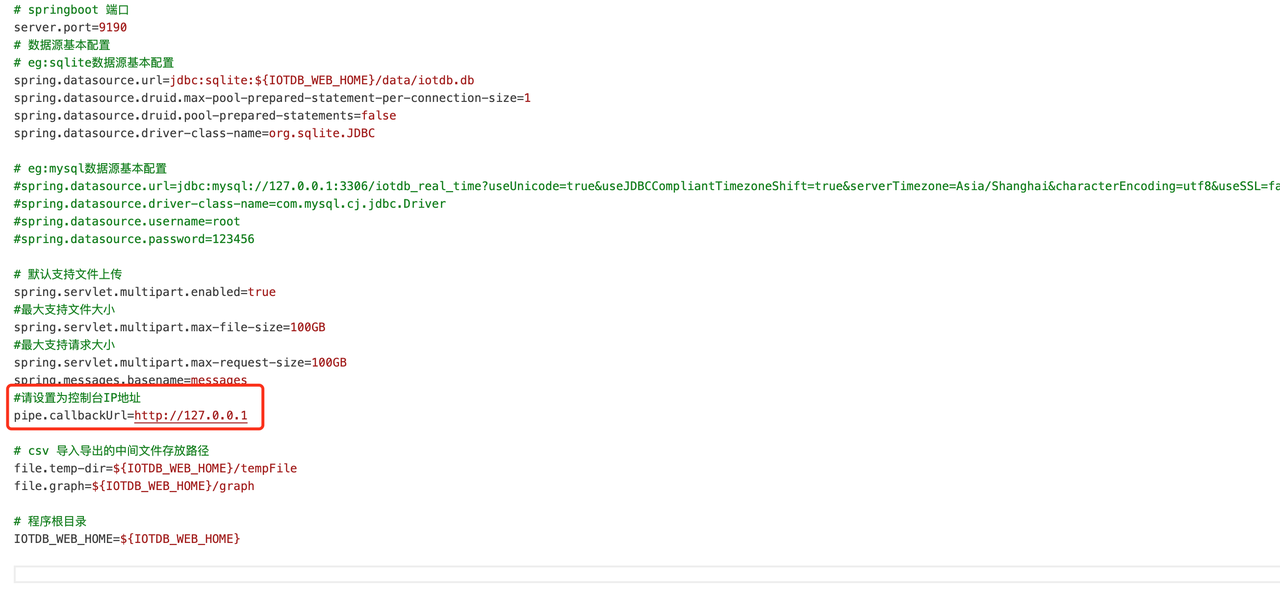
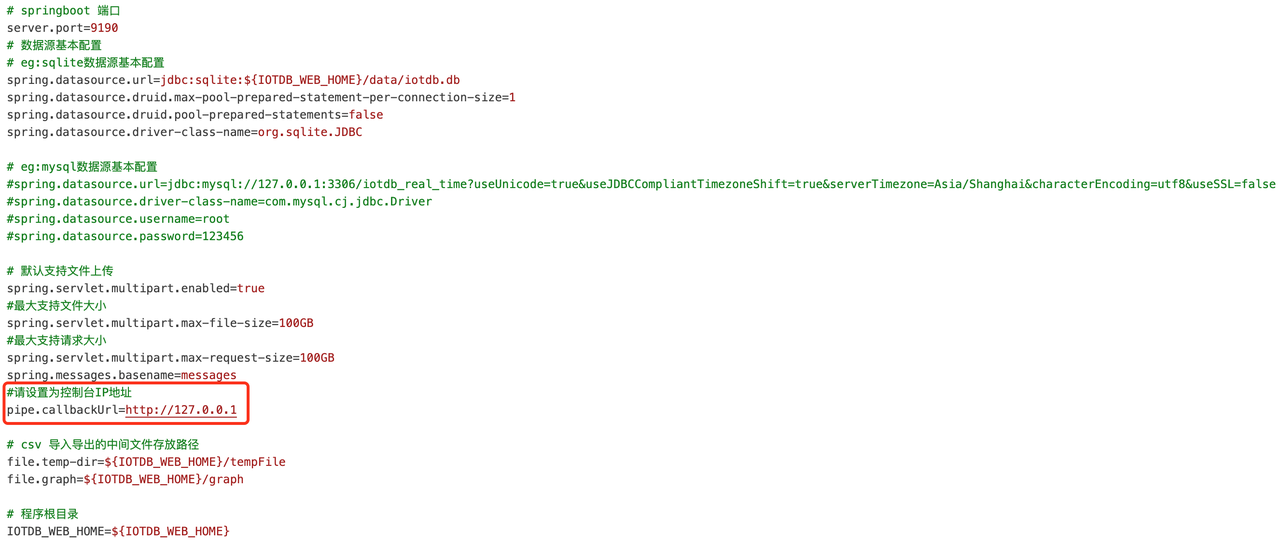
| Configuration | Before Modification | After
modification |
| ---------------- | ----------------------------------- |
----------------------------------------------- |
- | pipe.callbackUrl | pipe.callbackUrl=`http://127.0.0.1` |
pipe.callbackUrl=`http://<Deployed IP address>` |
+ | pipe.callbackUrl | pipe.callbackUrl=`http://127.0.0.1` |
pipe.callbackUrl=`http://<Workbench's IP address>` |
@@ -181,9 +181,9 @@ The visualization console is one of the supporting tools
for IoTDB. It is an off
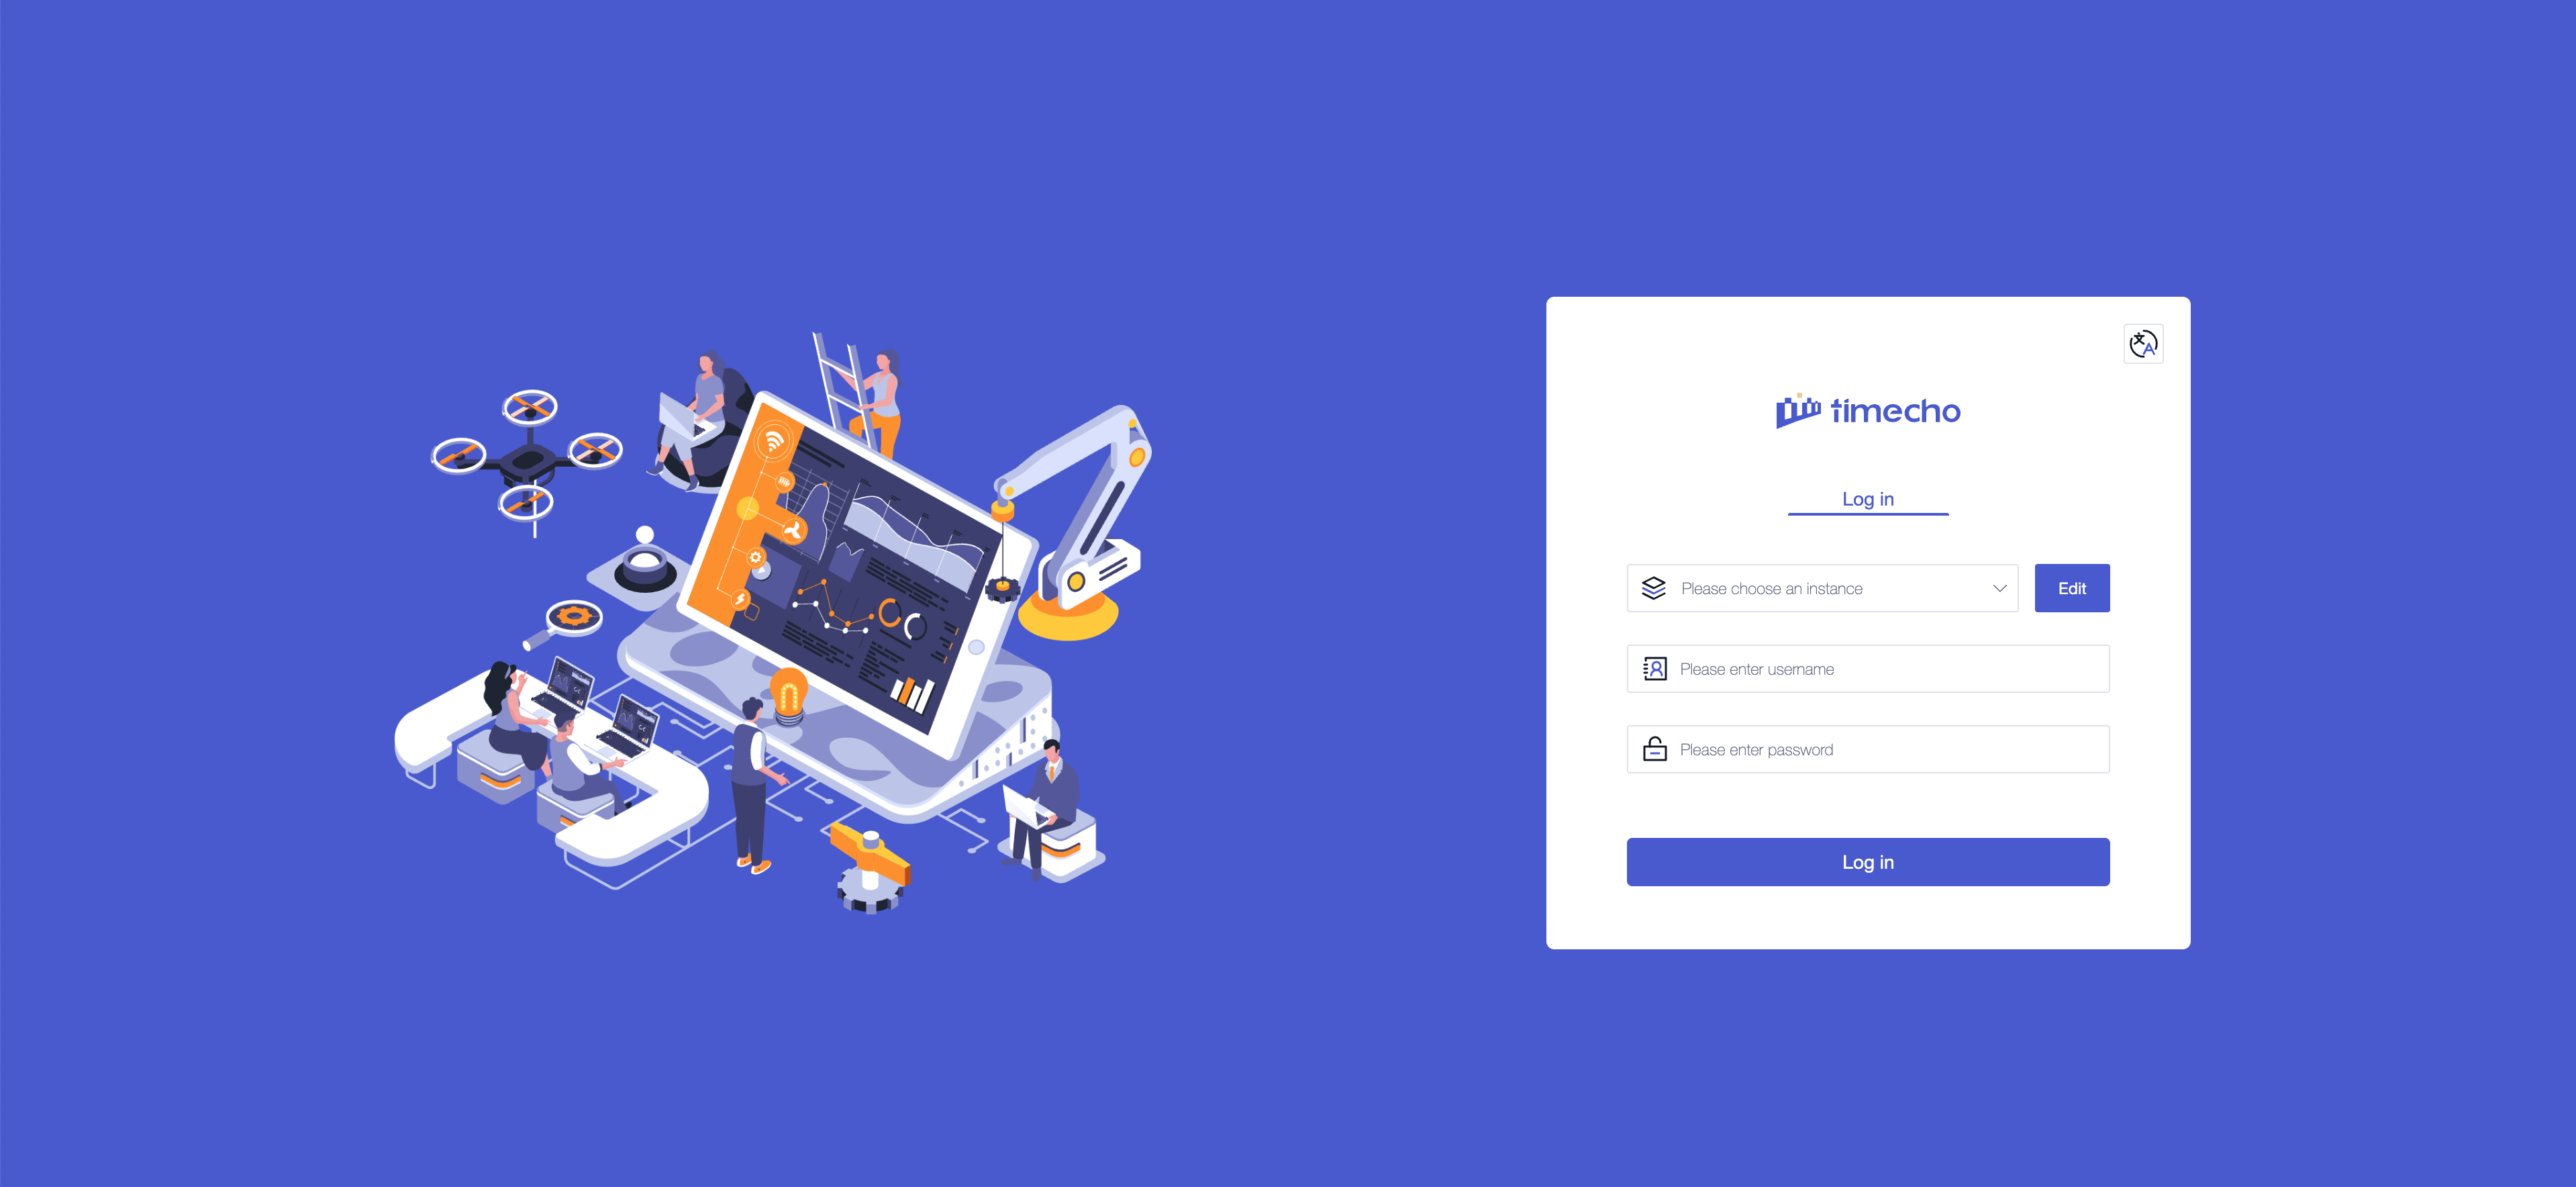
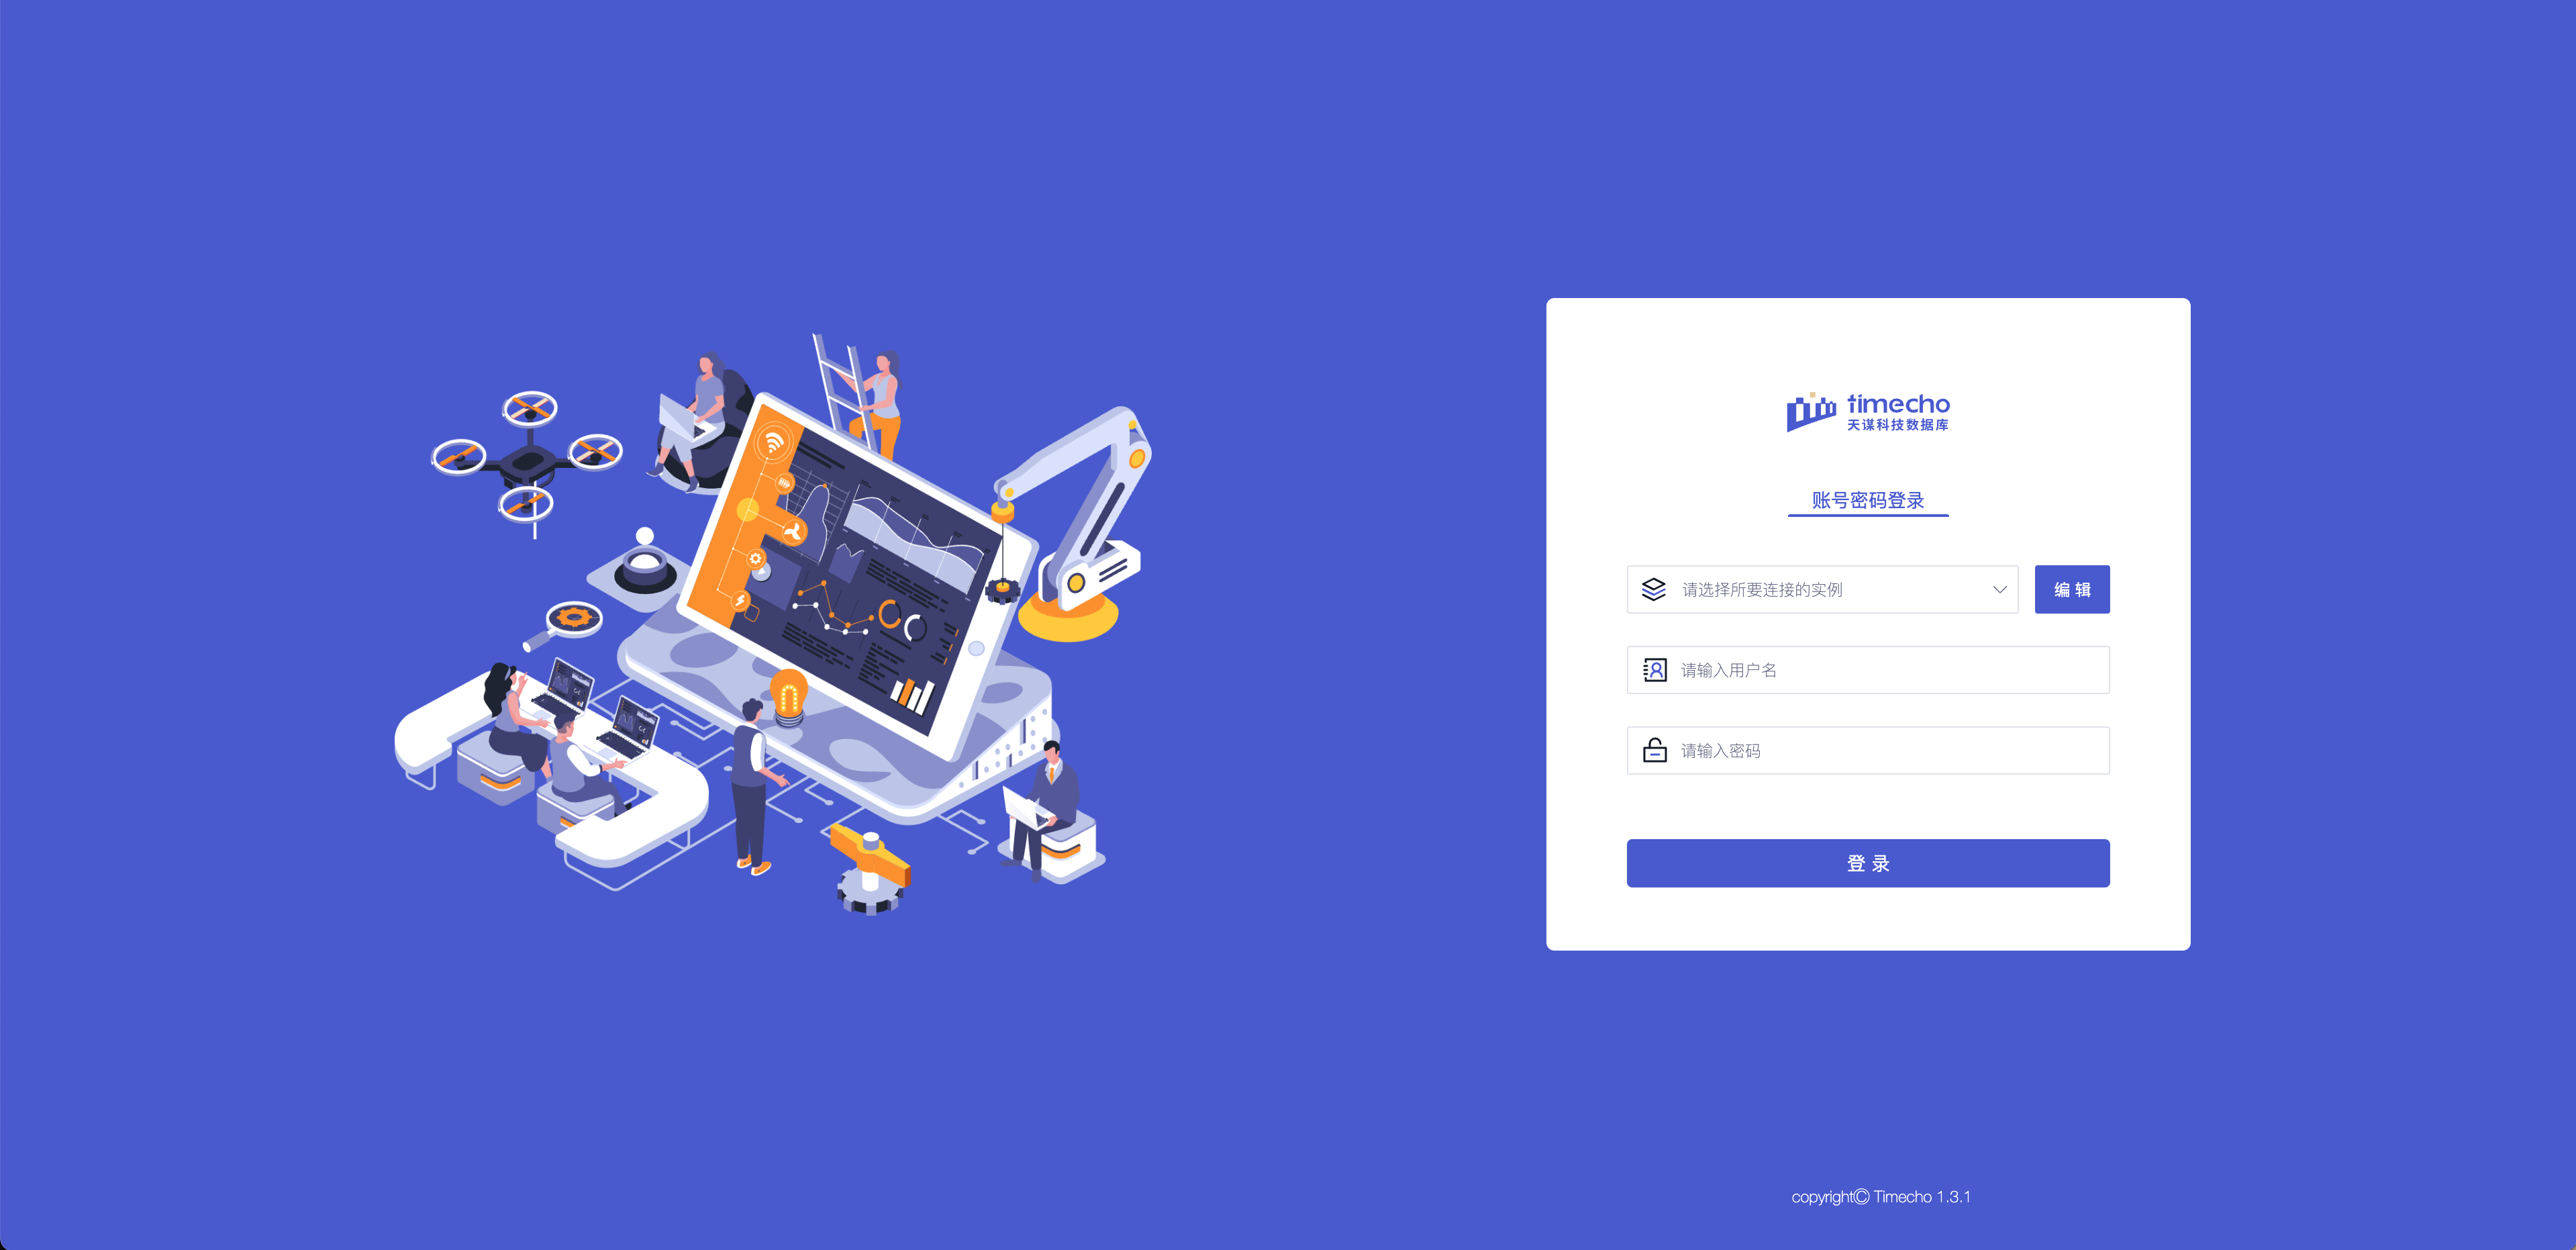
5. Verification successful: Open "http://Server IP: Port in configuration
file" in the browser to access, for example:“ http://127.0.0.1:9190 ”When the
login interface appears, it is considered successful
- 
+ 
-#### Linux版:
+#### Linux:
1. Enter the IoTDB Workbench -`<version>` directory
@@ -191,7 +191,7 @@ The visualization console is one of the supporting tools
for IoTDB. It is an off
| Configuration | Before Modification | After
modification |
| ---------------- | ----------------------------------- |
----------------------------------------------- |
- | pipe.callbackUrl | pipe.callbackUrl=`http://127.0.0.1` |
pipe.callbackUrl=`http://<Deployed IP address>` |
+ | pipe.callbackUrl | pipe.callbackUrl=`http://127.0.0.1` |
pipe.callbackUrl=`http://<Workbench's IP address>` |
@@ -208,12 +208,34 @@ The visualization console is one of the supporting tools
for IoTDB. It is an off
5. Verification successful: Open "http://Server IP: Port in configuration
file" in the browser to access, for example:"http://127.0.0.1:9190"; When the
login interface appears, it is considered successful
- 
+ 
+
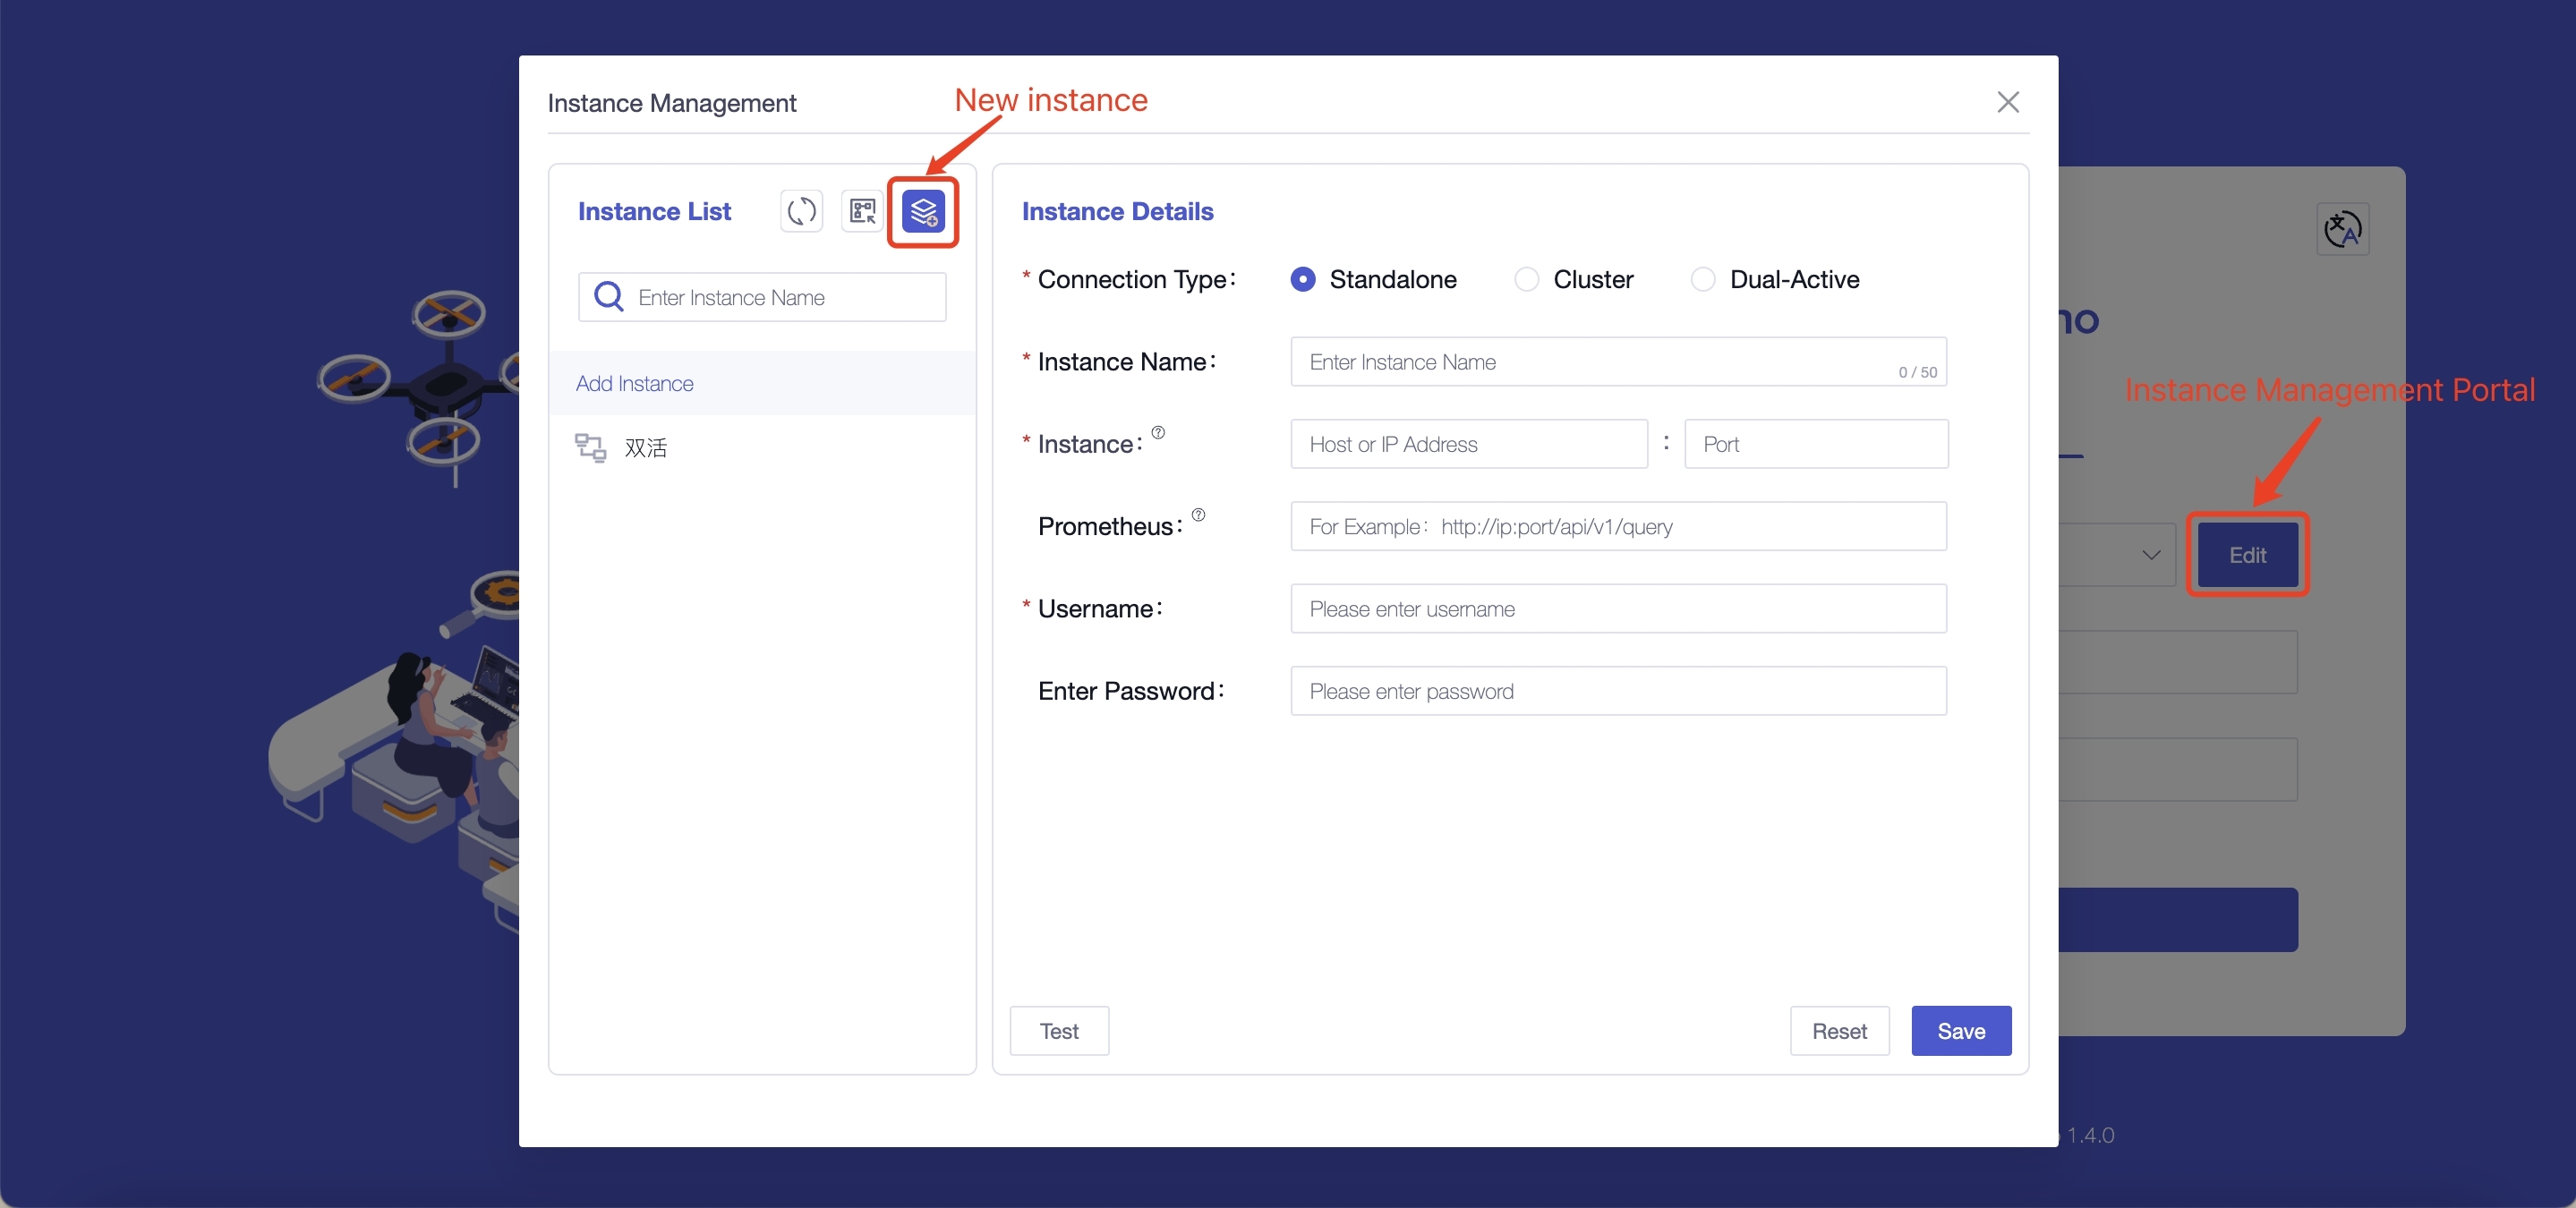
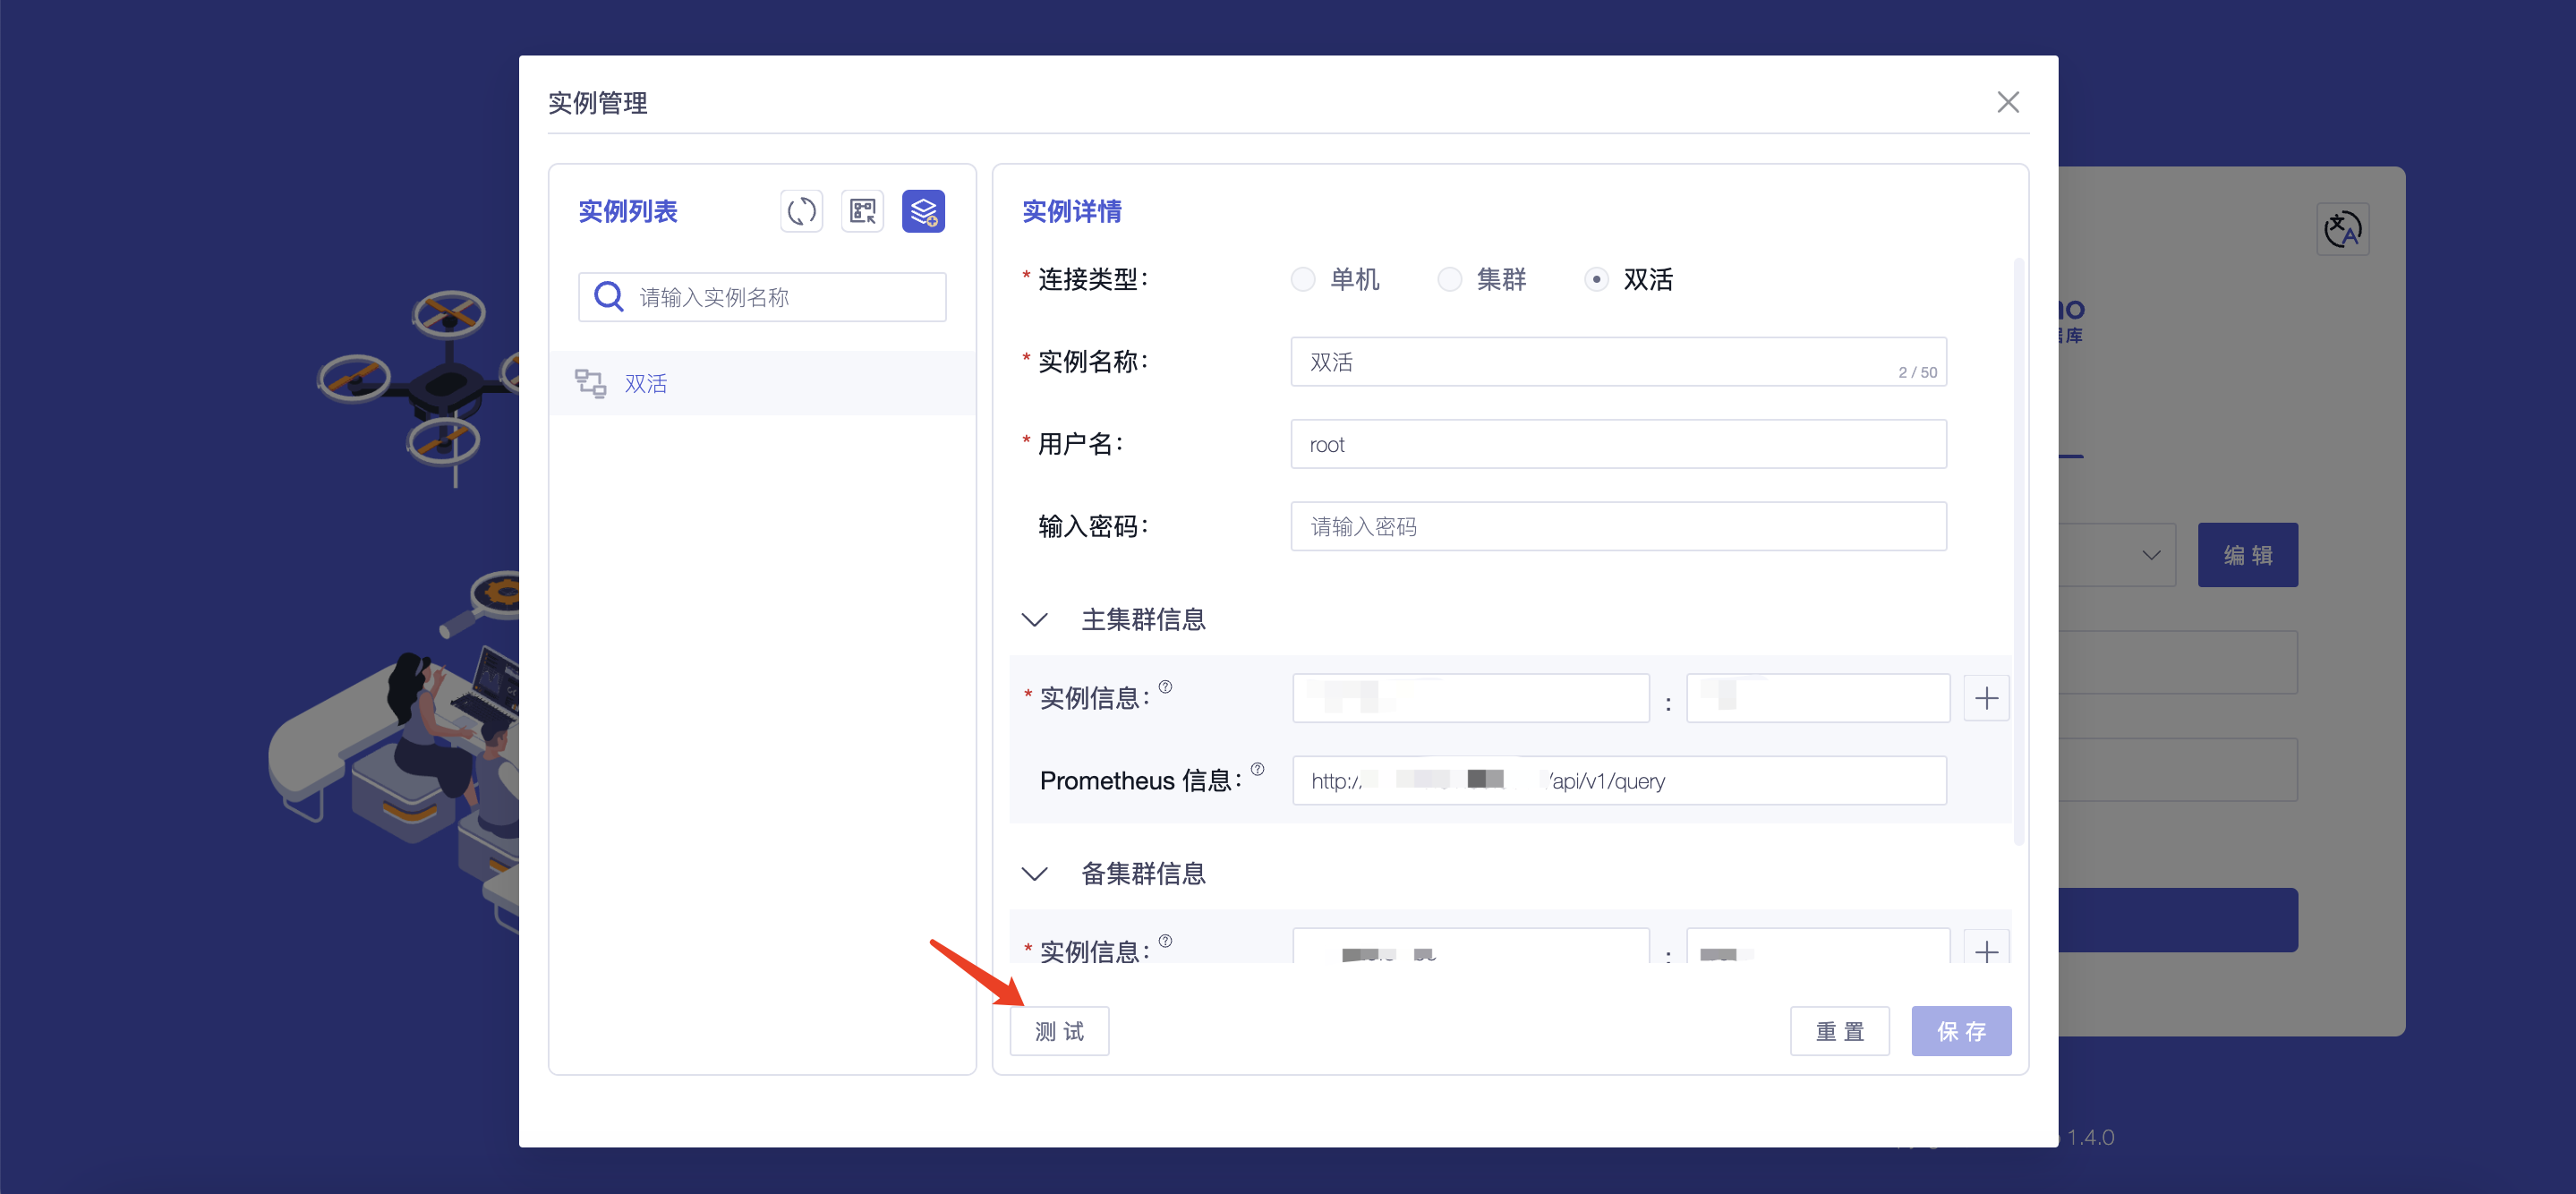
+### Step 4: Configure Instance Information
+
+1. Configure instance information: You only need to fill in the following
information to connect to the instance
+
+ 
+
+
+ | Field Name | Is It A Required Field | Field Meaning
| Default Value |
+ | --------------- | ---------------------- |
------------------------------------------------------------ | ------ |
+ | Connection Type | Yes | The content filled in for
different connection types varies, and supports selecting "single machine,
cluster, dual active" | - |
+ | Instance Name | Yes | You can distinguish different
instances based on their names, with a maximum input of 50 characters | - |
+ | Instance | Yes | Fill in the database address
(`dn_rpc_address` field in the `iotdb/conf/iotdb-system.properties` file) and
port number (`dn_rpc_port` field). Note: For clusters and dual active devices,
clicking the "+" button supports entering multiple instance information | -
|
+ | Prometheus | No | Fill in `http://<Prometheus
IP address>:<Prometheus port number>/app/v1/query` to view some monitoring
information on the homepage. We recommend that you configure and use it | -
|
+ | Username | Yes | Fill in the username for
IoTDB, supporting input of 4 to 32 characters, including uppercase and
lowercase letters, numbers, and special characters (! @ # $% ^&* () _+-=) |
root |
+ | Enter Password | No | Fill in the password for
IoTDB. To ensure the security of the database, we will not save the password.
Please fill in the password yourself every time you connect to the instance or
test | root |
+
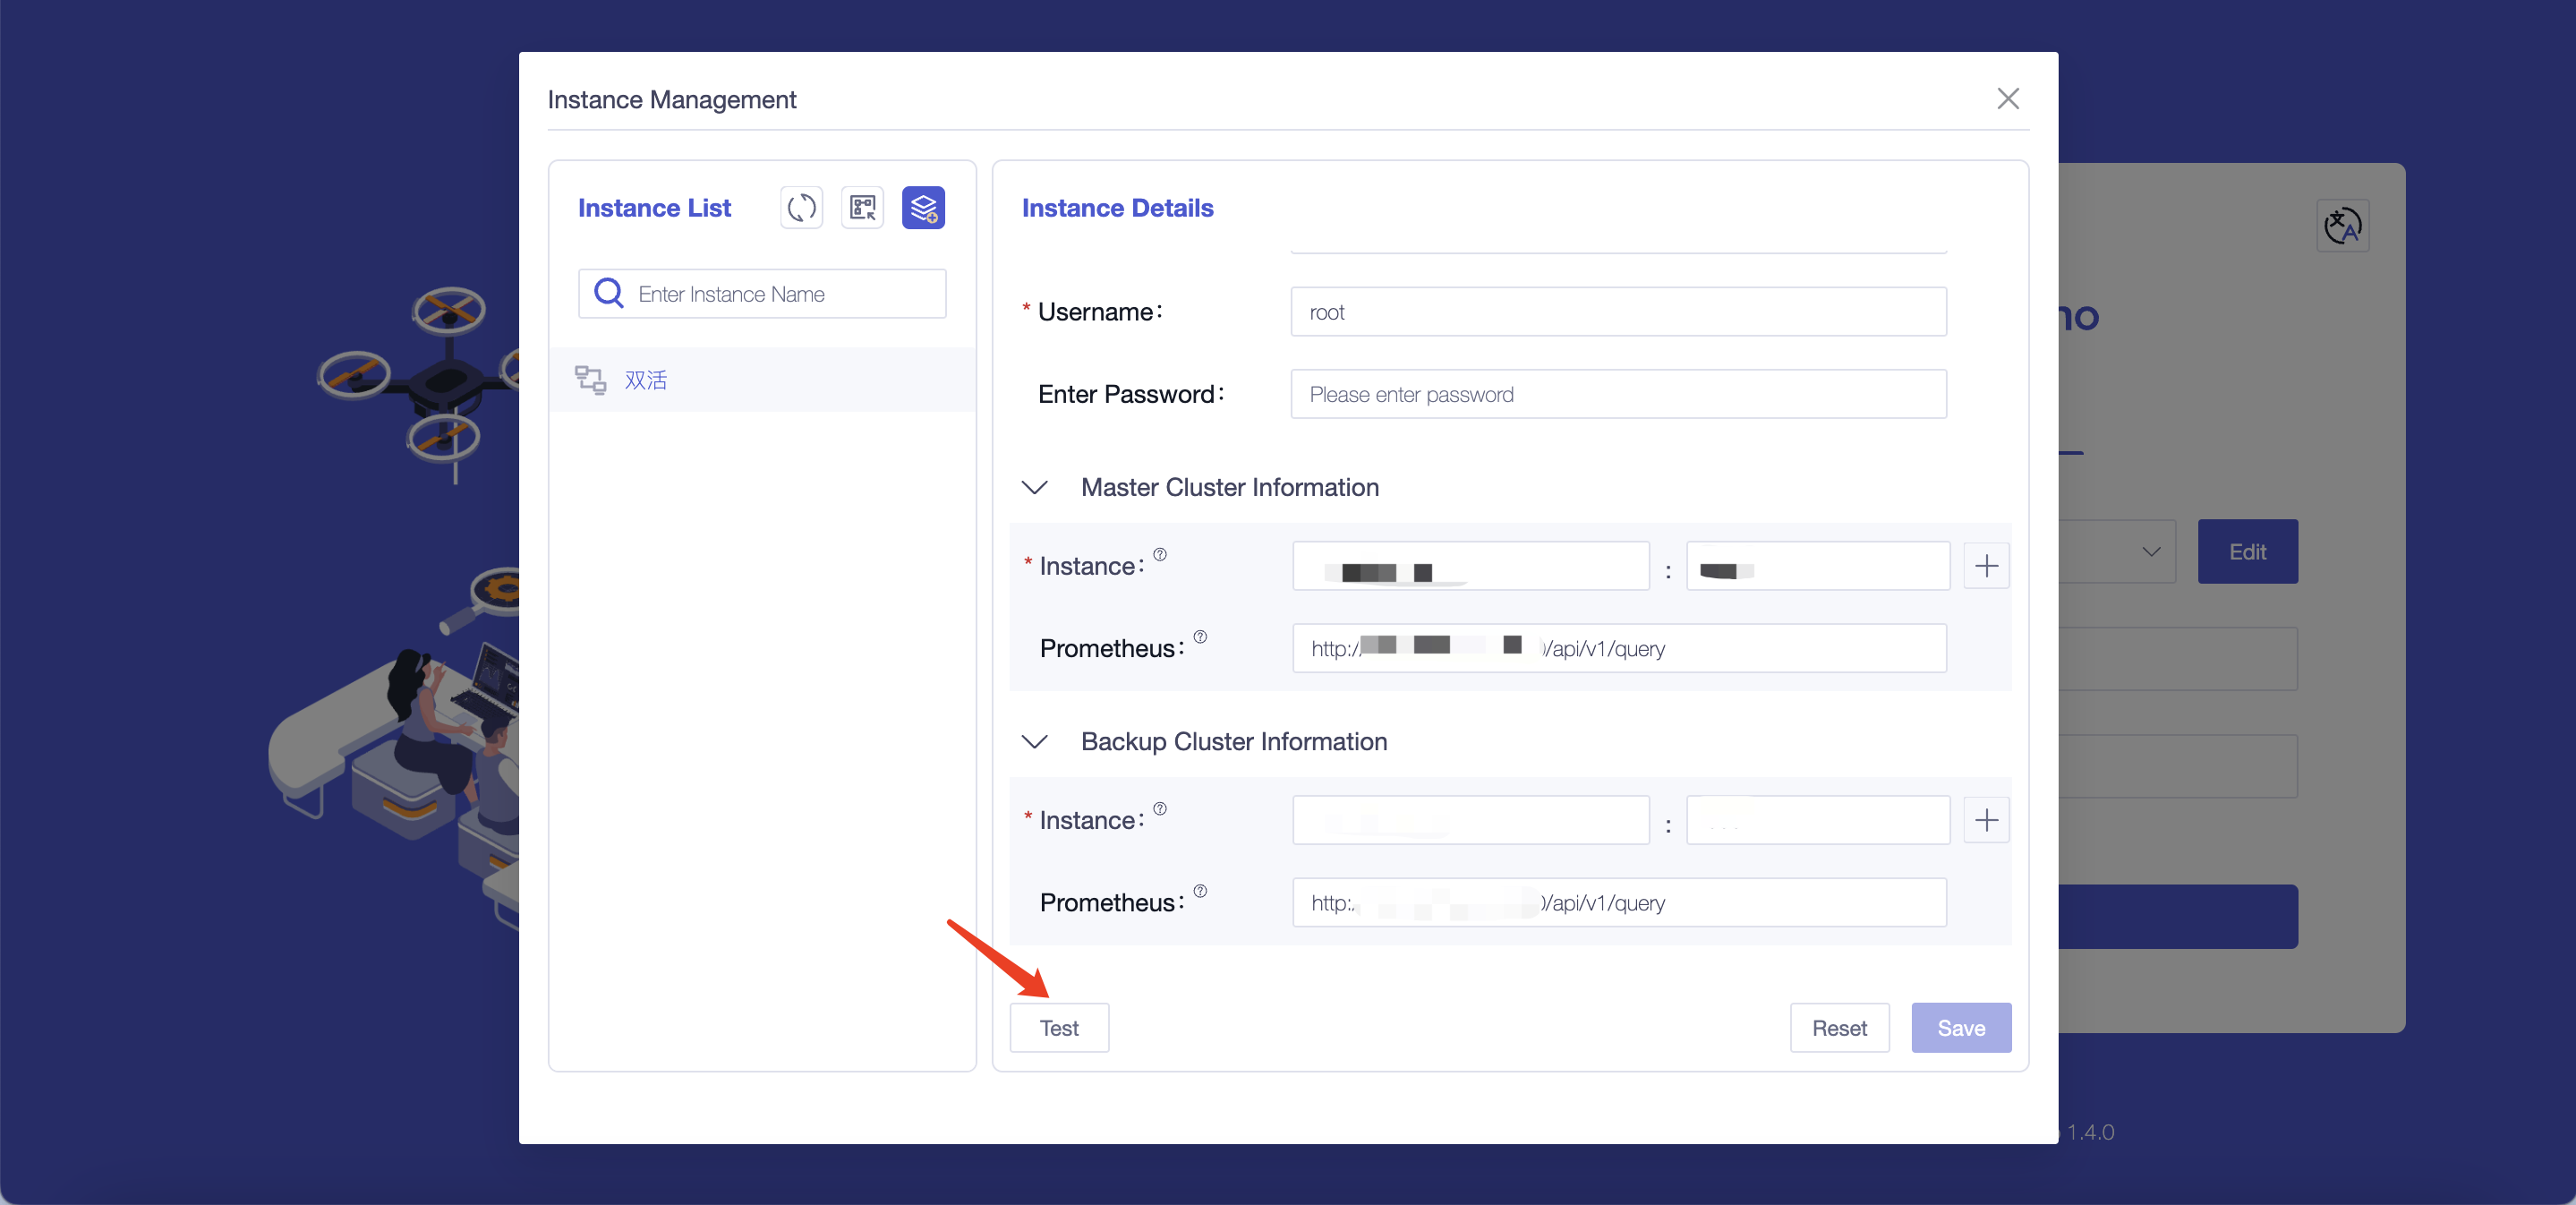
+2. Test the accuracy of the information filled in: You can perform a
connection test on the instance information by clicking the "Test" button
+
+ 
## Appendix: IoTDB and Workbench Version Comparison Table
| Workbench Version Number | Release Note
| Supports IoTDB Versions |
-| ------------------------ |
------------------------------------------------------------ |
------------------------- |
+| :------------------------: |
:------------------------------------------------------------: |
:-------------------------: |
+| V1.3.1 |New analysis methods have been added to the analysis function,
and functions such as optimizing import templates have been optimized
|V1.3.2 and above versions |
+| V1.3.0 | Add database configuration function
|V1.3.2 and above versions |
| V1.2.6 | Optimize the permission control function of each
module | V1.3.1 and above versions |
| V1.2.5 | The visualization function has added the concept
of "commonly used templates", and all interface optimization and page caching
functions have been supplemented | V1.3.0 and above versions |
| V1.2.4 | The calculation function has added the "import
and export" function, and the measurement point list has added the "time
alignment" field | V1.2.2 and above versions |
diff --git
a/src/UserGuide/latest/Deployment-and-Maintenance/workbench-deployment.md
b/src/UserGuide/latest/Deployment-and-Maintenance/workbench-deployment.md
index edc8b46..6654696 100644
--- a/src/UserGuide/latest/Deployment-and-Maintenance/workbench-deployment.md
+++ b/src/UserGuide/latest/Deployment-and-Maintenance/workbench-deployment.md
@@ -164,7 +164,7 @@ The visualization console is one of the supporting tools
for IoTDB. It is an off
| Configuration | Before Modification | After
modification |
| ---------------- | ----------------------------------- |
----------------------------------------------- |
- | pipe.callbackUrl | pipe.callbackUrl=`http://127.0.0.1` |
pipe.callbackUrl=`http://<Deployed IP address>` |
+ | pipe.callbackUrl | pipe.callbackUrl=`http://127.0.0.1` |
pipe.callbackUrl=`http://<Workbench's IP address>` |

@@ -181,9 +181,9 @@ The visualization console is one of the supporting tools
for IoTDB. It is an off
5. Verification successful: Open "http://Server IP: Port in configuration
file" in the browser to access, for example:“ http://127.0.0.1:9190 ”When the
login interface appears, it is considered successful
- 
+ 
-#### Linux版:
+#### Linux:
1. Enter the IoTDB Workbench -`<version>` directory
@@ -191,7 +191,7 @@ The visualization console is one of the supporting tools
for IoTDB. It is an off
| Configuration | Before Modification | After
modification |
| ---------------- | ----------------------------------- |
----------------------------------------------- |
- | pipe.callbackUrl | pipe.callbackUrl=`http://127.0.0.1` |
pipe.callbackUrl=`http://<Deployed IP address>` |
+ | pipe.callbackUrl | pipe.callbackUrl=`http://127.0.0.1` |
pipe.callbackUrl=`http://<Workbench's IP address>` |

@@ -208,12 +208,34 @@ The visualization console is one of the supporting tools
for IoTDB. It is an off
5. Verification successful: Open "http://Server IP: Port in configuration
file" in the browser to access, for example:"http://127.0.0.1:9190"; When the
login interface appears, it is considered successful
- 
+ 
+
+### Step 4: Configure Instance Information
+
+1. Configure instance information: You only need to fill in the following
information to connect to the instance
+
+ 
+
+
+ | Field Name | Is It A Required Field | Field Meaning
| Default Value |
+ | --------------- | ---------------------- |
------------------------------------------------------------ | ------ |
+ | Connection Type | | The content filled in for
different connection types varies, and supports selecting "single machine,
cluster, dual active" | - |
+ | Instance Name | Yes | You can distinguish different
instances based on their names, with a maximum input of 50 characters | - |
+ | Instance | Yes | Fill in the database address
(`dn_rpc_address` field in the `iotdb/conf/iotdb-datanode.properties` file) and
port number (`dn_rpc_port` field). Note: For clusters and dual active devices,
clicking the "+" button supports entering multiple instance information | -
|
+ | Prometheus | No | Fill in `http://<Prometheus
IP address>:<Prometheus port number>/app/v1/query` to view some monitoring
information on the homepage. We recommend that you configure and use it | -
|
+ | Username | Yes | Fill in the username for
IoTDB, supporting input of 4 to 32 characters, including uppercase and
lowercase letters, numbers, and special characters (! @ # $% ^&* () _+-=) |
root |
+ | Enter Password | No | Fill in the password for
IoTDB. To ensure the security of the database, we will not save the password.
Please fill in the password yourself every time you connect to the instance or
test | root |
+
+2. Test the accuracy of the information filled in: You can perform a
connection test on the instance information by clicking the "Test" button
+
+ 
## Appendix: IoTDB and Workbench Version Comparison Table
| Workbench Version Number | Release Note
| Supports IoTDB Versions |
-| ------------------------ |
------------------------------------------------------------ |
------------------------- |
+| :------------------------: |
:------------------------------------------------------------: |
:-------------------------: |
+| V1.3.1 |New analysis methods have been added to the analysis function,
and functions such as optimizing import templates have been optimized
|V1.3.2 and above versions |
+| V1.3.0 | Add database configuration function
|V1.3.2 and above versions |
| V1.2.6 | Optimize the permission control function of each
module | V1.3.1 and above versions |
| V1.2.5 | The visualization function has added the concept
of "commonly used templates", and all interface optimization and page caching
functions have been supplemented | V1.3.0 and above versions |
| V1.2.4 | The calculation function has added the "import
and export" function, and the measurement point list has added the "time
alignment" field | V1.2.2 and above versions |
diff --git
a/src/zh/UserGuide/Master/Deployment-and-Maintenance/workbench-deployment.md
b/src/zh/UserGuide/Master/Deployment-and-Maintenance/workbench-deployment.md
index 6b0dd44..f6df414 100644
--- a/src/zh/UserGuide/Master/Deployment-and-Maintenance/workbench-deployment.md
+++ b/src/zh/UserGuide/Master/Deployment-and-Maintenance/workbench-deployment.md
@@ -161,7 +161,7 @@
| 配置项 | 修改前 | 修改后
|
| ---------------- | --------------------------------- |
-------------------------------------- |
- | pipe.callbackUrl | pipe.callbackUrl=`http://127.0.0.1` |
pipe.callbackUrl=`http://<部署的IP地址>` |
+ | pipe.callbackUrl | pipe.callbackUrl=`http://127.0.0.1` |
pipe.callbackUrl=`http://<部署Workbench的IP地址>` |

@@ -178,7 +178,7 @@
5.
验证是否成功:浏览器中打开:"http://服务器ip:配置文件中端口"进行访问,例如:"http://127.0.0.1:9190",当出现登录界面时即为成功
- 
+ 
#### Linux版:
@@ -188,7 +188,7 @@
| 配置项 | 修改前 | 修改后
|
| ---------------- | --------------------------------- |
-------------------------------------- |
- | pipe.callbackUrl | pipe.callbackUrl=`http://127.0.0.1` |
pipe.callbackUrl=`http://<部署的IP地址>` |
+ | pipe.callbackUrl | pipe.callbackUrl=`http://127.0.0.1` |
pipe.callbackUrl=`http://<部署Workbench的IP地址>` |

@@ -205,12 +205,34 @@
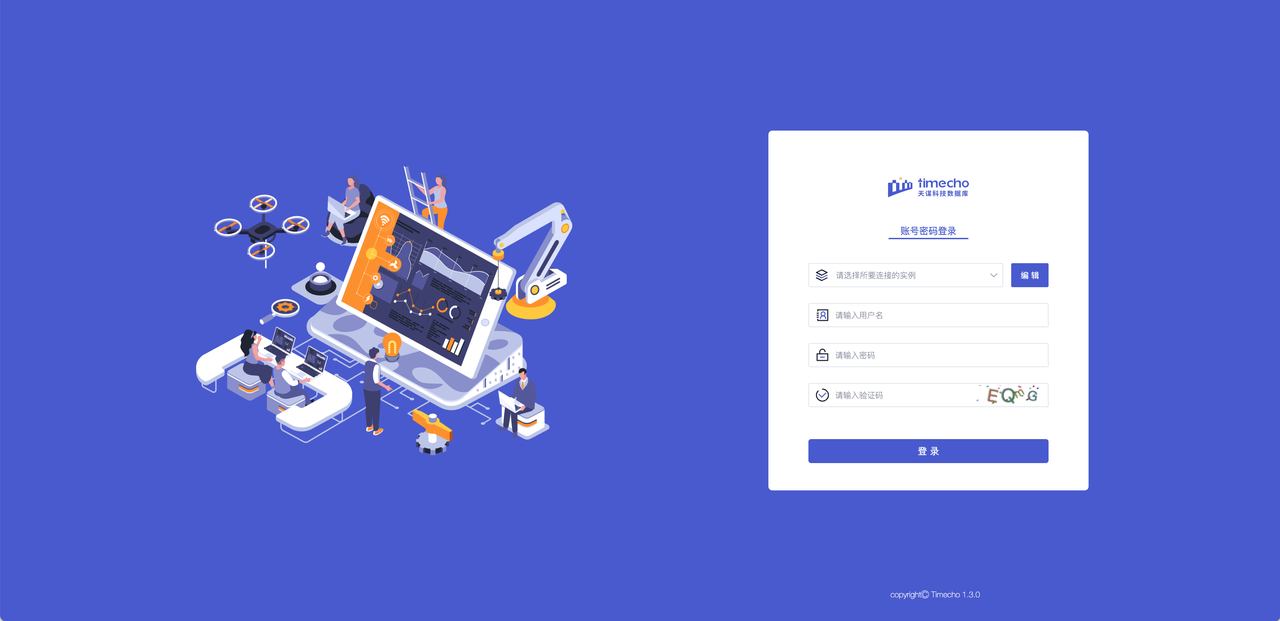
5. 验证是否成功:浏览器中打开
"http://服务器ip:配置文件中端口"进行访问,例如:"http://127.0.0.1:9190",当出现登录界面时即为成功
- 
+ 
+
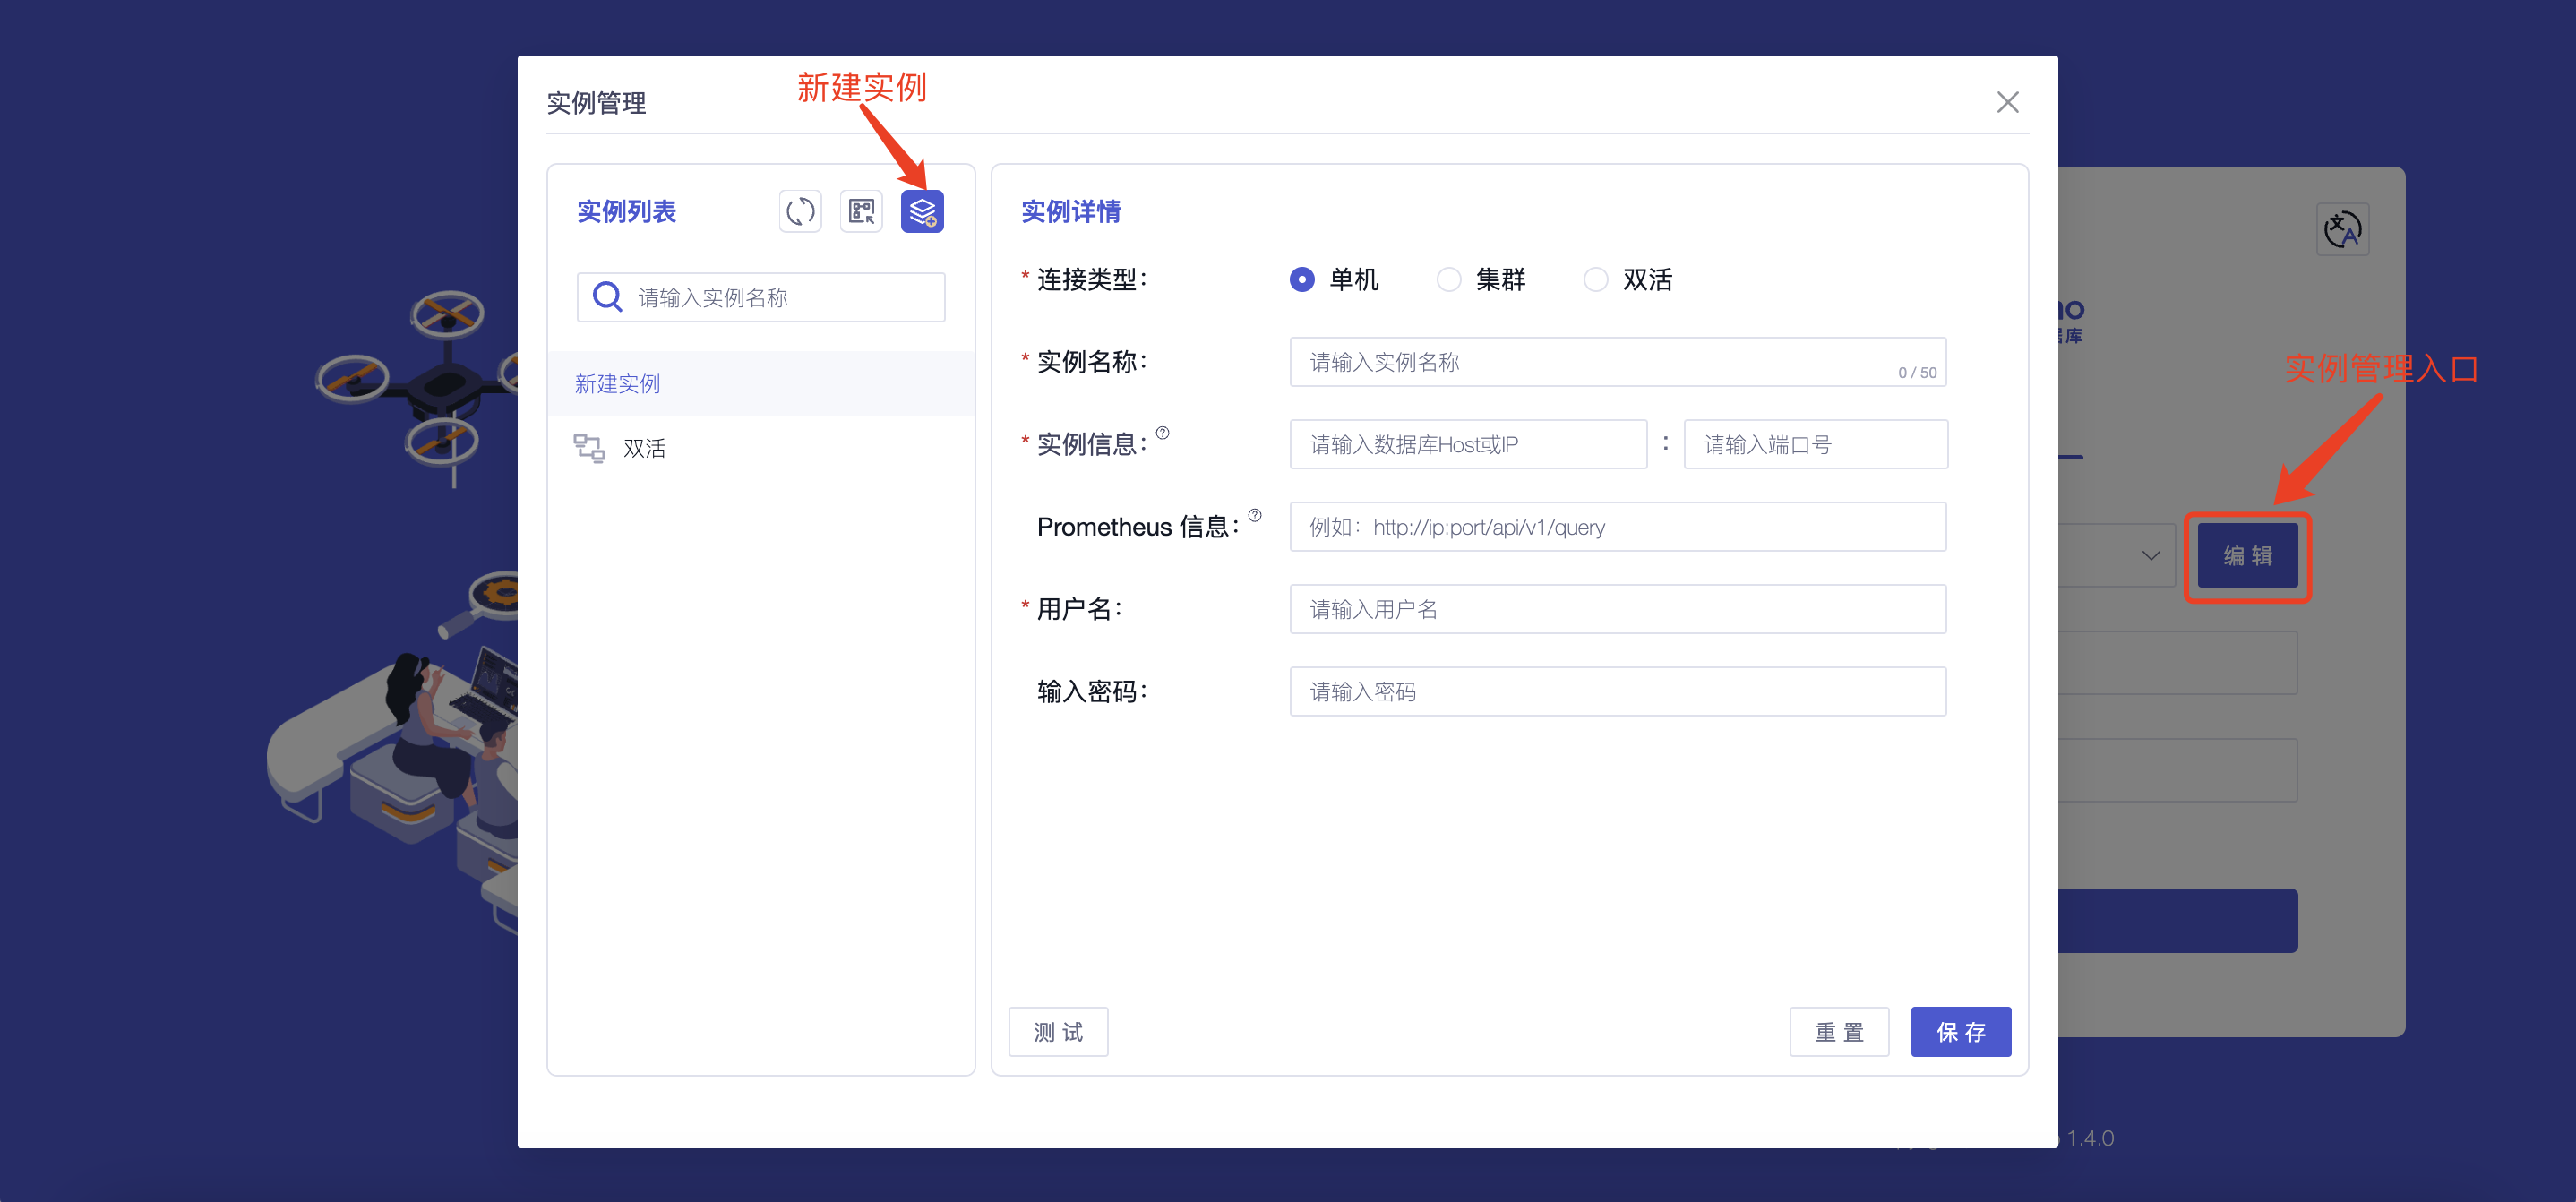
+### 步骤四:配置实例信息
+
+1. 配置实例信息:您只需要填写以下信息即可连接到实例
+
+
+
+ | 字段名称 | 是否为必填项 | 字段含义
| 默认值 |
+ | :---------------: | :------------: |
:------------------------------------------------------------: | :------: |
+ | 连接类型 | 是 | 不同连接类型连接所填内容不同,支持选择“单机、集群、双活” | - |
+ | 实例名称 | 是 | 您可根据名称对不同实例进行区分,最多输入 50 个字符 | -
|
+ | 实例信息 | 是 | 填写数据库的地址(iotdb/conf/iotdb-system.properties
文件中 dn_rpc_address 字段)以及端口号(dn_rpc_port字段)注:对于集群和双活点击“+”支持输入多个实例信息 | - |
+ | Prometheus 信息 | 否 |
填写“http:/<Prometheus的IP地址>:<Prometheus的端口号>/api/v1/query”即可通过首页查看部分监控信息,推荐您进行配置使用
| - |
+ | 用户名 | 是 | 填写IoTDB的用户名,支持输入 4~32
个字符,可使用英文大小写字母、数字、特殊字符(!@#$%^&*()_+-=) | root |
+ | 密码 | 否 |
填写IoTDB的密码,为了保证数据库的安全我们不会对密码进行保存,请您在每次连接实例或测试时自行填写 | root |
+
+2. 测试所填信息的准确性:您可以通过点击“测试”按钮对实例信息进行连接测试
+
+
+
## 附录:IoTDB与控制台版本对照表
| 控制台版本号 | 版本说明 |
可支持IoTDB版本 |
-| ------------ | ------------------------------------------------------------
| ---------------- |
+| :------------: |
:------------------------------------------------------------: |
:----------------: |
+| V1.3.1 | 分析功能新增分析方式,优化导入模版等功能 | V1.3.2及以上版本 |
+| V1.3.0 | 新增数据库配置功能,优化部分版本细节 | V1.3.2及以上版本 |
| V1.2.6 | 优化各模块权限控制功能 |
V1.3.1及以上版本 |
| V1.2.5 | 可视化功能新增“常用模版”概念,所有界面优化补充页面缓存等功能 | V1.3.0及以上版本 |
| V1.2.4 | 计算功能新增“导入、导出”功能,测点列表新增“时间对齐”字段 | V1.2.2及以上版本 |
diff --git
a/src/zh/UserGuide/latest/Deployment-and-Maintenance/workbench-deployment.md
b/src/zh/UserGuide/latest/Deployment-and-Maintenance/workbench-deployment.md
index 6b0dd44..ad202e8 100644
--- a/src/zh/UserGuide/latest/Deployment-and-Maintenance/workbench-deployment.md
+++ b/src/zh/UserGuide/latest/Deployment-and-Maintenance/workbench-deployment.md
@@ -161,7 +161,7 @@
| 配置项 | 修改前 | 修改后
|
| ---------------- | --------------------------------- |
-------------------------------------- |
- | pipe.callbackUrl | pipe.callbackUrl=`http://127.0.0.1` |
pipe.callbackUrl=`http://<部署的IP地址>` |
+ | pipe.callbackUrl | pipe.callbackUrl=`http://127.0.0.1` |
pipe.callbackUrl=`http://<部署Workbench的IP地址>` |

@@ -178,7 +178,7 @@
5.
验证是否成功:浏览器中打开:"http://服务器ip:配置文件中端口"进行访问,例如:"http://127.0.0.1:9190",当出现登录界面时即为成功
- 
+ 
#### Linux版:
@@ -188,7 +188,7 @@
| 配置项 | 修改前 | 修改后
|
| ---------------- | --------------------------------- |
-------------------------------------- |
- | pipe.callbackUrl | pipe.callbackUrl=`http://127.0.0.1` |
pipe.callbackUrl=`http://<部署的IP地址>` |
+ | pipe.callbackUrl | pipe.callbackUrl=`http://127.0.0.1` |
pipe.callbackUrl=`http://<部署Workbench的IP地址>` |

@@ -205,12 +205,34 @@
5. 验证是否成功:浏览器中打开
"http://服务器ip:配置文件中端口"进行访问,例如:"http://127.0.0.1:9190",当出现登录界面时即为成功
- 
+ 
+
+### 步骤四:配置实例信息
+
+1. 配置实例信息:您只需要填写以下信息即可连接到实例
+
+

+
+ | 字段名称 | 是否为必填项 | 字段含义
| 默认值 |
+ | :---------------: | :------------: |
:------------------------------------------------------------: | :------: |
+ | 连接类型 | 是 | 不同连接类型连接所填内容不同,支持选择“单机、集群、双活” | - |
+ | 实例名称 | 是 | 您可根据名称对不同实例进行区分,最多输入 50 个字符 | -
|
+ | 实例信息 | 是 | 填写数据库的地址(iotdb/conf/iotdb-datanode.properties
文件中 dn_rpc_address 字段)以及端口号(dn_rpc_port字段)注:对于集群和双活点击“+”支持输入多个实例信息 | - |
+ | Prometheus 信息 | 否 |
填写“http:/<Prometheus的IP地址>:<Prometheus的端口号>/api/v1/query”即可通过首页查看部分监控信息,推荐您进行配置使用
| - |
+ | 用户名 | 是 | 填写IoTDB的用户名,支持输入 4~32
个字符,可使用英文大小写字母、数字、特殊字符(!@#$%^&*()_+-=) | root |
+ | 密码 | 否 |
填写IoTDB的密码,为了保证数据库的安全我们不会对密码进行保存,请您在每次连接实例或测试时自行填写 | root |
+
+2. 测试所填信息的准确性:您可以通过点击“测试”按钮对实例信息进行连接测试
+
+

+
## 附录:IoTDB与控制台版本对照表
| 控制台版本号 | 版本说明 |
可支持IoTDB版本 |
-| ------------ | ------------------------------------------------------------
| ---------------- |
+| :------------: |
:------------------------------------------------------------: |
:----------------: |
+| V1.3.1 | 分析功能新增分析方式,优化导入模版等功能 | V1.3.2及以上版本 |
+| V1.3.0 | 新增数据库配置功能,优化部分版本细节 | V1.3.2及以上版本 |
| V1.2.6 | 优化各模块权限控制功能 |
V1.3.1及以上版本 |
| V1.2.5 | 可视化功能新增“常用模版”概念,所有界面优化补充页面缓存等功能 | V1.3.0及以上版本 |
| V1.2.4 | 计算功能新增“导入、导出”功能,测点列表新增“时间对齐”字段 | V1.2.2及以上版本 |